Exam 10: Graphing Equations and Inequalities
Exam 1: The Whole Numbers360 Questions
Exam 2: Multiplying and Dividing Fractions234 Questions
Exam 3: Adding and Subtracting Fractions157 Questions
Exam 4: Decimals271 Questions
Exam 5: Ratio, Proportion, and Percent297 Questions
Exam 6: Geometry280 Questions
Exam 7: Statistics and Probability133 Questions
Exam 8: Real Numbers and Introduction to Algebra483 Questions
Exam 9: Equations, Inequalities, and Problem Solving224 Questions
Exam 10: Graphing Equations and Inequalities312 Questions
Exam 11: Systems of Equations111 Questions
Exam 12: Exponents and Polynomials386 Questions
Exam 13: Factoring Polynomials233 Questions
Exam 14: Rational Expressions249 Questions
Exam 15: Roots and Radicals220 Questions
Exam 16: Quadratic Equations and Nonlinear Graphs198 Questions
Exam 17: Algebraic Equations and Inequalities199 Questions
Select questions type
State whether the graph of each inequality includes its corresponding boundary line.
-x + y > 7
(True/False)
4.7/5  (41)
(41)
State whether the slope of the line is positive, negative, 0, or is undefined.
-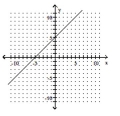
(Multiple Choice)
4.8/5 (43)
Solve the problem.
-The table gives the number of basic cable TV subscribers (in millions)for a certain region for the years shown. Year Basic Cable TV Subscribers (in millions) 2000 0.2 2001 1.1 2002 0.7 2003 1.2 2004 1.8 2005 1.9 a. Write this data as a set of ordered pairs of the form (year, number of basic cable TV subscribers in millions). b. Create a scatter diagram of the data. Be sure to label the axes properly. 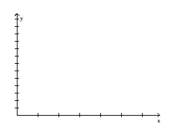
(Multiple Choice)
4.9/5 (40)
Fill in the blank with one of the words or phrases listed below. y-axis x-axis solution linear standard point-slope x-intercept y -intercept y x slope relation domain range direct inverse slope-intercept function
-The vertical number line in the rectangular coordinate system is called the_______ .
(Multiple Choice)
4.8/5 (38)
Name the quadrant or axis in which the point lies.
-(-2, -11)
(Multiple Choice)
4.8/5 (33)
Complete the ordered pairs so that they are solutions of the given linear equation.
-y = xx - 4; (6, ), ( ,-5)
(Multiple Choice)
4.7/5 (42)
Solve.
-The table shows the average hourly wage for non-managerial office workers in a town in Indiana (in dollars)for the
years shown. Write each paired data as an ordered pair of the form (year, wage). Then create a scatter diagram of the
ordered pairs. Average Hourly Wage Year Average Hourly Wage (in dollars) 1994 10.54 1995 11.16 1996 12.45 1997 11.94 1998 12.05 1999 13.71
(Essay)
4.9/5 (37)
State whether the slope of the line is positive, negative, 0, or is undefined.
-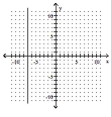
(Multiple Choice)
4.9/5 (37)
Write an equation to describe the variation. Use k for the constant of proportionality.
-z varies directly as s
(Multiple Choice)
5.0/5 (41)
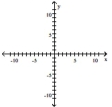
Complete the ordered pairs for the given linear equation. Then plot the points and graph the equation by connecting the
points.
-y = 2x + 5
(Multiple Choice)
4.8/5 (43)
Name the quadrant or axis in which the point lies.
-(0, -10)
(Multiple Choice)
4.9/5 (34)
Decide whether the relation defines a function.
-{(-8, 3), (-8, -9), (1, 6), (6, -5), (7, 2)}
(Multiple Choice)
4.9/5 (31)
Filters
- Essay(0)
- Multiple Choice(0)
- Short Answer(0)
- True False(0)
- Matching(0)