Exam 1: Functions and Graphs
Exam 1: Functions and Graphs71 Questions
Exam 2: Limits and the Derivative188 Questions
Exam 3: Additional Derivative Topics98 Questions
Exam 4: Graphing and Optimization126 Questions
Exam 5: Integration38 Questions
Exam 7: Multivariable Calculus92 Questions
Exam 8: Appendix A: Basic Algebra Review44 Questions
Exam 9: Appendix B: Special Topics Online at Googlmjbxrg20 Questions
Select questions type
Find the slope and y intercept of the graph of the equation.
-
Free
(Multiple Choice)
4.8/5  (28)
(28)
Correct Answer: Verified
C
Solve the problem.
-A small company that makes hand-sewn leather shoes has fixed costs of $320 a day, and total costs of $1200 per day at an output of 20 pairs of shoes per day. Assume that total cost C is linearly related to output x. Find an
Equation of the line relating output to cost. Write the final answer in the form C = mx + b.
Free
(Multiple Choice)
4.7/5 (34)
Correct Answer:Verified
A
Solve the problem. Express your answer as an integer or simplified fraction.
-7x - (5x - 1) = 2
(Multiple Choice)
4.8/5 (26)
Solve the problem. Express your answer as an integer or simplified fraction.
--4(4x + 4) - 1 = -5(x + 1) + 3x
(Multiple Choice)
4.8/5 (37)
Provide an appropriate response.
-Given two points s (  ) and and
  ), the ra, the rtio of the change in y to the change in x is called.
(Multiple Choice)
4.8/5 (39)
Solve the problem. Express your answer as an integer or simplified fraction.
-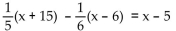
(Multiple Choice)
4.7/5 (42)
Solve the problem. Express your answer as an integer or simplified fraction.
-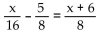
(Multiple Choice)
4.8/5 (39)
Solve the problem. Express your answer as an integer or simplified fraction.
-
(Multiple Choice)
4.9/5 (40)
Use the REGRESSION feature on a graphing calculator.
-The paired data below consists of the temperature on randomly chosen days and the amount of a certain kind of plant grew (in millimeters). 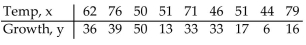 Find the linear function that predicts a plant's growth as a function of the temperature. Round your answer to two
Decimal places.
Find the linear function that predicts a plant's growth as a function of the temperature. Round your answer to two
Decimal places.
(Multiple Choice)
4.8/5 (30)
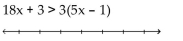
Solve the inequality and graph. Express your answer in interval notation.
-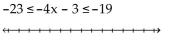
(Multiple Choice)
4.8/5 (42)
Find the slope of the line containing the given points.
-(9, -7); (-6, 6)
(Multiple Choice)
4.8/5 (29)
Determine whether the slope of the line is positive, negative, zero, or undefined.
-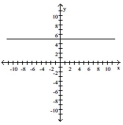
(Multiple Choice)
4.9/5 (37)
Solve the problem.
-Assume that the price per unit d of a certain item to the consumer is given by the equation d = 35 - .10x, where x is the number of units in demand. The price per unit from the supplier is given by the equation s = .2x + 20,
Where x is the number of units supplied. Find the equilibrium price and the equilibrium quantity.
(Multiple Choice)
4.7/5 (24)
Graph the linear equation and determine its slope, if it exists.
-3x + 5y = 11 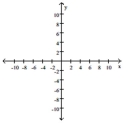
(Multiple Choice)
4.7/5 (37)
Determine whether the slope of the line is positive, negative, zero, or undefined.
-
(Multiple Choice)
4.9/5 (37)
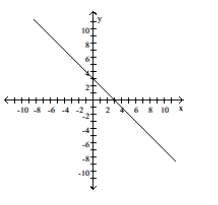
Provide an appropriate response.
-Write the equation of the line in the following graph. 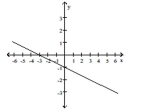
(Multiple Choice)
4.7/5 (37)
Use the REGRESSION feature on a graphing calculator.
-In the table below, x represents the number of years since 2000 and y represents sales (in thousands of dollars) of a clothing company. Use the regression equation to estimate sales in the year 2006. Round to the nearest
Thousand dollars. 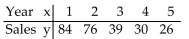
(Multiple Choice)
4.7/5 (43)
Solve the inequality and graph. Express your answer in interval notation.
-
(Multiple Choice)
4.9/5 (24)
Filters
- Essay(0)
- Multiple Choice(0)
- Short Answer(0)
- True False(0)
- Matching(0)