Exam 11: Statistics
Exam 1: Problem Solving35 Questions
Exam 2: Sets73 Questions
Exam 3: Logic86 Questions
Exam 4: Numeration Systems89 Questions
Exam 5: The Real Number System151 Questions
Exam 6: Topics in Algebra97 Questions
Exam 7: Consumer Mathematics130 Questions
Exam 8: Measurement60 Questions
Exam 9: Geometry98 Questions
Exam 10: Probability and Counting Techniques120 Questions
Exam 11: Statistics174 Questions
Exam 12: Voting Methods58 Questions
Exam 13: Graph Theory33 Questions
Exam 14: Available Online: Other Mathematical Systems37 Questions
Select questions type
Find the equation of the regression line. 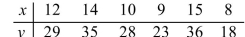
Free
(Multiple Choice)
4.8/5  (34)
(34)
Correct Answer: Verified
C
The mean, also known as the arithmetic average, is found by .
Free
(Essay)
4.8/5 (31)
Correct Answer:Verified
adding the values of the data and dividing by the total number of values
Based on data compiled by the World Health Organization, the mean systolic blood pressure in the
United States is 120, the standard deviation is 16, and the pressures are normally distributed. Find
The percent of individuals who have blood pressure between 120 and 128.
(Multiple Choice)
4.8/5 (31)
For the 8 test scores shown, which score corresponds to a percentile rank of 62.5? 
(Short Answer)
4.8/5 (28)
Find the mean, median, mode, and midrange for the data provided. The data shows hours spent at
Work for a group of men. 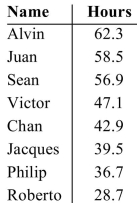
(Multiple Choice)
4.9/5 (37)
The GPAs of 20 students are given below. Construct a stem and leaf plot for the data using whole
numbers as stems and the decimals as leaves. 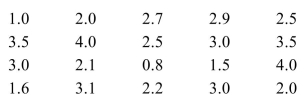
(Essay)
4.8/5 (33)
Use a scatter plot to determine the relationship between the x values and the y values. 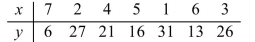
(Multiple Choice)
4.9/5 (36)
Suppose that you collect a very large number of maple tree seed pods, record their lengths and draw
A histogram of the data using narrow class widths. Next you collect a very large number of adult
Women's heights and again draw a histogram using narrow classes. How would you expect the two
Histograms to compare?
(Multiple Choice)
4.8/5 (30)
Find the value for r and test the significance of r at the 5% level and at the 1% level. 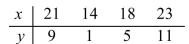
(Multiple Choice)
4.7/5 (28)
If a data value has a Z score of , then half of the data are below that value, and half are above.
(Short Answer)
4.8/5 (37)
If a student scored 1,484 on the SAT test which has a mean of 1,026 and a standard deviation of 210
and then scored 126 on an IQ test with a mean of 100 and a standard deviation of 15, determine
which test she did better on and explain your reasoning.
(Essay)
4.8/5 (30)
A bookstore recorded the type of books 30 customers purchased during a weekend sale (R = romance novel, S
= science fiction, N = nonfiction, C = children's fiction). Construct a frequency distribution for the data. 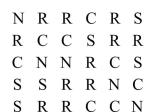
(Essay)
4.9/5 (30)
The frequency distribution below was obtained by monitoring the number of vacation days per year
taken by twenty-five employees. Construct a histogram and frequency polygon for the data. 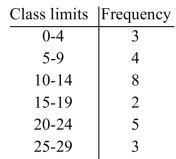
(Essay)
4.8/5 (36)
Assume that males have a mean height of 69.1 in. with a standard deviation of 2.9 in., and females
Have a mean height of 63.7 in. with a standard deviation of 2.7 in. Based on Z scores, would a 5'6"
Male or a 5'2" female be taller compared to the rest of their gender?
(Multiple Choice)
4.8/5 (27)
The exam grades of 31 students were used to obtain the frequency distribution below. Construct a
frequency polygon for the data. 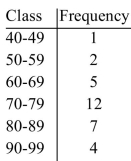
(Essay)
4.8/5 (34)
Filters
- Essay(0)
- Multiple Choice(0)
- Short Answer(0)
- True False(0)
- Matching(0)