Exam 21: Applying Graphs to Economics
Exam 1: Introducing the Economic Way of Thinking176 Questions
Exam 2: Production Possibilities, Opportunity Cost, and Economic Growth200 Questions
Exam 3: Market Demand and Supply348 Questions
Exam 4: Markets in Action261 Questions
Exam 5: Gross Domestic Product223 Questions
Exam 6: Business Cycles and Unemployment194 Questions
Exam 7: Inflation126 Questions
Exam 8: The Keynesian Model235 Questions
Exam 9: The Keynesian Model in Action202 Questions
Exam 10: Aggregate Demand and Supply187 Questions
Exam 11: Fiscal Policy223 Questions
Exam 12: The Public Sector127 Questions
Exam 13: Federal Deficits, Surpluses, and the National Debt99 Questions
Exam 14: Money and the Federal Reserve System154 Questions
Exam 15: Money Creation243 Questions
Exam 16: Monetary Policy213 Questions
Exam 17: The Phillips Curve and Expectations Theory120 Questions
Exam 18: International Trade and Finance248 Questions
Exam 19: Economies in Transition104 Questions
Exam 20: Growth and the Less-Developed Countries117 Questions
Exam 21: Applying Graphs to Economics68 Questions
Exam 22: Consumer Surplus, Producer Surplus, and Market Efficiency68 Questions
Exam 23: the Self-Correcting Aggregate Demand and Supply Model83 Questions
Exam 24: Policy Disputes Using the Self-Correcting Aggregate Demand and Supply Model36 Questions
Select questions type
Exhibit 1A-2 Straight line  In Exhibit 1A-2, the slope of straight line CD is:
(Multiple Choice)
4.7/5  (38)
(38)
Exhibit 1A-6 Straight line 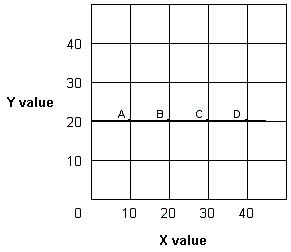 In Exhibit 1A-6, the slope of straight line A-D is:
(Multiple Choice)
4.8/5 (33)
Measured between two points on a curve, the ratio of the change in the variable on the vertical axis to the change in the variable on the horizontal axis is the:
(Multiple Choice)
4.9/5 (33)
Which of the following is used to illustrate an independent relationship between two variables?
(Multiple Choice)
4.9/5 (29)
Exhibit 1A-1 Straight line  Straight line AB in Exhibit 1A-1 shows that:
(Multiple Choice)
4.8/5 (36)
Exhibit 1A-4 Straight line 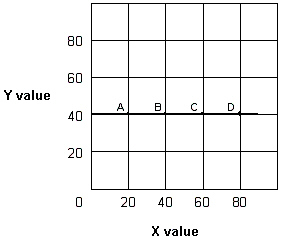 In Exhibit 1A-4, the slope of the straight line A-D is:
(Multiple Choice)
4.8/5 (31)
A downward-sloping straight line exhibits a direct relationship between two variables.
(True/False)
4.8/5 (45)
Exhibit 1A-5 Straight line  In Exhibit 1A-5, the slope of straight line CD is:
(Multiple Choice)
4.8/5 (36)
Exhibit 1A-1 Straight line 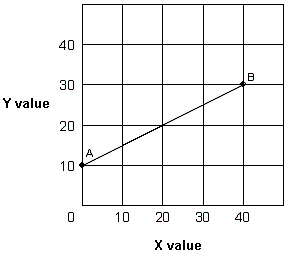 In Exhibit 1A-1, the slope of straight line AB is:
(Multiple Choice)
4.8/5 (42)
Exhibit 1A-5 Straight line 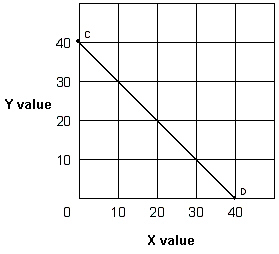 As shown in Exhibit 1A-5, the slope of straight line CD:
(Multiple Choice)
5.0/5 (32)
Exhibit 1A-1 Straight line  In Exhibit 1A-1, the slope of straight line AB is:
(Multiple Choice)
4.7/5 (37)
Which of the following pairs is the most likely to exhibit an inverse relationship?
(Multiple Choice)
4.8/5 (38)
Exhibit 1A-7 Straight line relationship 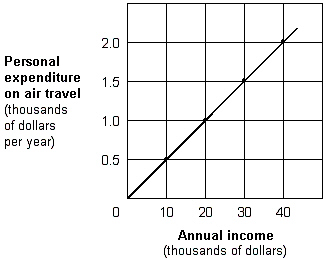 Which of the following would cause a shift in the relationship shown in Exhibit 1A-7?
(Multiple Choice)
5.0/5 (40)
Exhibit 1A-5 Straight line  In Exhibit 1A-5, as X increases along the horizontal axis, corresponding to points C-D on the line, the Y values decrease. The relationship between the X and Y variables is:
(Multiple Choice)
4.8/5 (39)
Exhibit 1A-2 Straight line 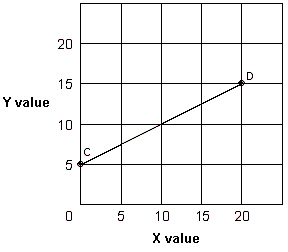 As shown in Exhibit 1A-2, the slope of straight line CD:
(Multiple Choice)
5.0/5 (33)
Distinguish a direct and an inverse or negative relationship. Provide an example of each type of relationship.
(Essay)
4.8/5 (38)
Filters
- Essay(0)
- Multiple Choice(0)
- Short Answer(0)
- True False(0)
- Matching(0)