Exam 21: Applying Graphs to Economics
Exam 1: Introducing the Economic Way of Thinking176 Questions
Exam 2: Production Possibilities, Opportunity Cost, and Economic Growth200 Questions
Exam 3: Market Demand and Supply348 Questions
Exam 4: Markets in Action261 Questions
Exam 5: Gross Domestic Product223 Questions
Exam 6: Business Cycles and Unemployment194 Questions
Exam 7: Inflation126 Questions
Exam 8: The Keynesian Model235 Questions
Exam 9: The Keynesian Model in Action202 Questions
Exam 10: Aggregate Demand and Supply187 Questions
Exam 11: Fiscal Policy223 Questions
Exam 12: The Public Sector127 Questions
Exam 13: Federal Deficits, Surpluses, and the National Debt99 Questions
Exam 14: Money and the Federal Reserve System154 Questions
Exam 15: Money Creation243 Questions
Exam 16: Monetary Policy213 Questions
Exam 17: The Phillips Curve and Expectations Theory120 Questions
Exam 18: International Trade and Finance248 Questions
Exam 19: Economies in Transition104 Questions
Exam 20: Growth and the Less-Developed Countries117 Questions
Exam 21: Applying Graphs to Economics68 Questions
Exam 22: Consumer Surplus, Producer Surplus, and Market Efficiency68 Questions
Exam 23: the Self-Correcting Aggregate Demand and Supply Model83 Questions
Exam 24: Policy Disputes Using the Self-Correcting Aggregate Demand and Supply Model36 Questions
Select questions type
Direct relationships are illustrated using upward-sloping lines and curves.
(True/False)
4.9/5  (37)
(37)
Exhibit 1A-9 Multi-curve graph 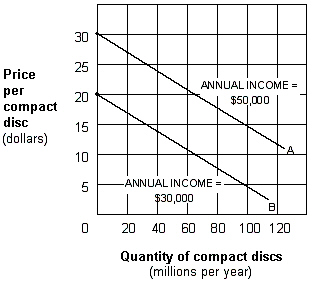 Exhibit 1A-9 represents a three-variable relationship. As the annual income of consumers falls from $50,000 (line A)to $30,000 (line B), the result is a:
(Multiple Choice)
4.9/5 (34)
Graphically express a direct and an inverse or negative relationship. What could cause a shift in a line or curve expressing a relationship between two variables?
(Essay)
4.7/5 (33)
Exhibit 1A-7 Straight line relationship  What is the slope of the line shown in Exhibit 1A-7?
(Multiple Choice)
4.7/5 (25)
An upward-sloping straight line exhibits a direct relationship between two variables.
(True/False)
4.9/5 (33)
Exhibit 1A-6 Straight line 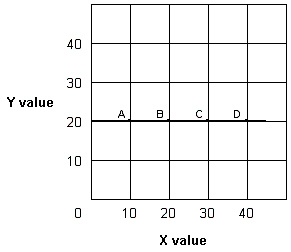 In Exhibit 1A-6, as X increases along the horizontal axis, corresponding to points A-D on the line, the Y values remain unchanged at 20 units. The relationship between the X and Y variables is:
(Multiple Choice)
4.8/5 (41)
If two variables are inversely related, then they change in the same direction.
(True/False)
4.7/5 (31)
Suppose two variables are directly related. If one variable rises, then the other variable:
(Multiple Choice)
4.9/5 (43)
Exhibit 1A-7 Straight line relationship 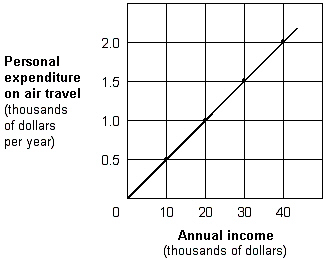 According to Exhibit 1A-7, the relationship between annual income and air-travel expenditures is:
(Multiple Choice)
4.7/5 (40)
A change in a third variable not on either axis of a graph is illustrated with a:
(Multiple Choice)
4.9/5 (41)
Exhibit 1A-2 Straight line  In Exhibit 1A-2, as X increases along the horizontal axis, corresponding to points C-D on the line, the Y values increase. The relationship between the X and Y variables is:
(Multiple Choice)
4.8/5 (30)
Exhibit 1A-3 Straight line 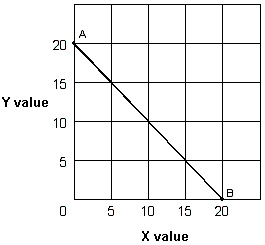 In Exhibit 1A-3, as X increases along the horizontal axis, corresponding to points A-B on the line, the Y values decrease. The relationship between the X and Y variables is:
(Multiple Choice)
4.9/5 (34)
Exhibit 1A-3 Straight line  In Exhibit 1A-3, the slope of straight line AB is:
(Multiple Choice)
4.8/5 (40)
The slope of a line is calculated as the ratio of the "rise" over the "run".
(True/False)
4.9/5 (37)
Exhibit 1A-1 Straight line 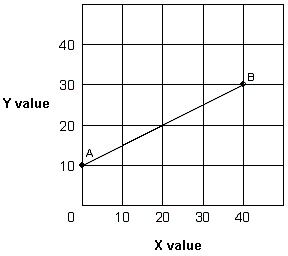 In Exhibit 1A-1, as X increases along the horizontal axis, corresponding to points A-B on the line, the Y values increase. The relationship between the X and Y variables is:
(Multiple Choice)
4.7/5 (35)
Exhibit 1A-5 Straight line 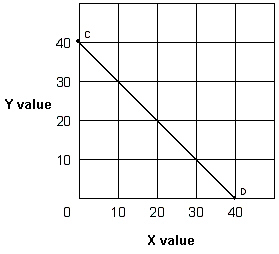 Straight line CD in Exhibit 1A-5 shows that:
(Multiple Choice)
4.8/5 (44)
Exhibit 1A-5 Straight line  In Exhibit 1A-5, the slope for straight line CD is:
(Multiple Choice)
4.9/5 (39)
Exhibit 1A-2 Straight line 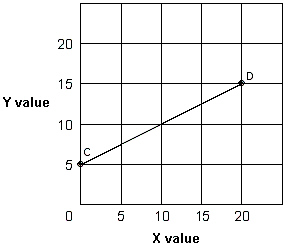 Straight line CD in Exhibit 1A-2 shows that:
(Multiple Choice)
4.8/5 (41)
Filters
- Essay(0)
- Multiple Choice(0)
- Short Answer(0)
- True False(0)
- Matching(0)