Exam 4: Creating and Formatting Information Graphics
Exam 1: Creating and Editing a Presentation With Pictures103 Questions
Exam 2: Enhancing a Presentation With Pictures, Shapes, and Wordart103 Questions
Exam 3: Reusing a Presentation and Adding Media and Animation103 Questions
Exam 4: Creating and Formatting Information Graphics103 Questions
Exam 5: Collaborating on and Delivering a Presentation103 Questions
Exam 6: Navigating Presentations Using Hyperlinks and Action Buttons103 Questions
Exam 8: Powerpoint: Office 2013 and Windows 8 Essential Concepts and Skills103 Questions
Exam 7: Creating a Self-Running Presentation Containing Animation103 Questions
Exam 9: Office 365 Essentials53 Questions
Select questions type
You can click the _________________________ button in the Type group on the CHART TOOLS DESIGN tab to change a chart's type after you create it.
Free
(Short Answer)
4.9/5  (35)
(35)
Correct Answer: Verified
Change Chart Type
The ____ assists you in creating a graphic because you can direct your attention to developing and editing the message without being concerned with the actual graphic.
Free
(Multiple Choice)
4.9/5 (27)
Correct Answer:Verified
B
To draw attention to a particular area of a pie chart, you can explode one or more slices.
Free
(True/False)
4.8/5 (41)
Correct Answer:Verified
True
Briefly describe how to choose an appropriate SmartArt layout, and explain which layouts are best for which functions.
(Essay)
4.8/5 (38)
Which of the following chart types displays the effect on one variable when another variable changes?
(Multiple Choice)
4.9/5 (32)
Audiences generally focus first on the ____ displayed on a slide.
(Multiple Choice)
4.9/5 (43)
Microsoft Office 2013 includes tables, which are visual representations of your ideas.
(True/False)
4.8/5 (38)
If you increase or decrease the font size of one shape, the font size in other shapes will not be affected.
(True/False)
4.9/5 (28)
Discuss the importance of obtaining information for your graphics from credible sources and giving credit to those sources.
(Essay)
4.9/5 (27)
You can reopen the Excel worksheet and edit the chart's data by clicking the ____ button (CHART TOOLS DESIGN tab | Data group).
(Multiple Choice)
4.9/5 (45)
It is not possible to add a three-dimensional style to SmartArt graphics.
(True/False)
4.8/5 (35)
Which button should you tap or click to display the Select menu?
(Multiple Choice)
4.9/5 (40)
A(n) ____ often can help convey relationships between key points in your presentation.
(Multiple Choice)
4.9/5 (32)
Modified Multiple Choice The SmartArt layouts have a variety of ____ to correspond to the major points you want your audience to remember.
(Multiple Choice)
4.9/5 (36)
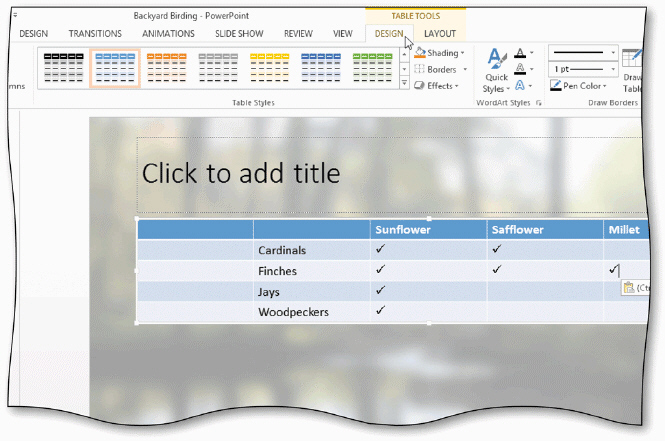 When you apply a table style, use the More button on the_________________________ DESIGN tab, as shown in the accompanying figure.
(Short Answer)
4.7/5 (28)
All SmartArt graphic shapes will enlarge proportionally when you adjust the graphic's height and width. .
(True/False)
4.8/5 (40)
To provide space for graphics and text, you can _________________________ two or more cells to create one large cell.
(Short Answer)
4.9/5 (35)
Filters
- Essay(0)
- Multiple Choice(0)
- Short Answer(0)
- True False(0)
- Matching(0)