Exam 4: Creating and Formatting Information Graphics
Exam 1: Creating and Editing a Presentation With Pictures103 Questions
Exam 2: Enhancing a Presentation With Pictures, Shapes, and Wordart103 Questions
Exam 3: Reusing a Presentation and Adding Media and Animation103 Questions
Exam 4: Creating and Formatting Information Graphics103 Questions
Exam 5: Collaborating on and Delivering a Presentation103 Questions
Exam 6: Navigating Presentations Using Hyperlinks and Action Buttons103 Questions
Exam 8: Powerpoint: Office 2013 and Windows 8 Essential Concepts and Skills103 Questions
Exam 7: Creating a Self-Running Presentation Containing Animation103 Questions
Exam 9: Office 365 Essentials53 Questions
Select questions type
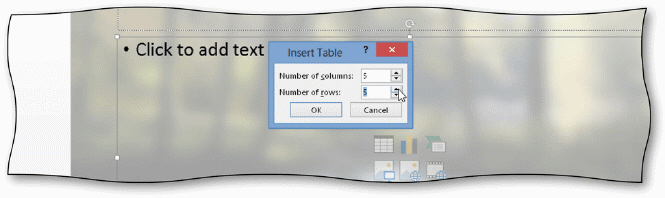 You can open the Insert Table dialog box, shown in the accompanying figure, by clicking the ____ button in the content placeholder.
(Multiple Choice)
5.0/5  (30)
(30)
You can rotate an entire chart clockwise until it is in the desired position.
(True/False)
4.9/5 (30)
The SmartArt layouts have a variety of shapes, arrows, and lines to correspond to the major points you want your audience to remember.
(True/False)
4.8/5 (32)
Which of the following is the path to the Table Styles gallery?
(Multiple Choice)
4.9/5 (38)
You quickly can convert small amounts of slide text and pictures into a SmartArt graphic.
(True/False)
4.8/5 (38)
Which of the following chart types uses vertical bars to compare values over a period of time?
(Multiple Choice)
4.9/5 (36)
Modified Multiple Choice The data in a table cell can be aligned ____.
(Multiple Choice)
4.8/5 (35)
When working in a Text Pane, which of the following shortcut keys adds a tab character?
(Multiple Choice)
4.9/5 (38)
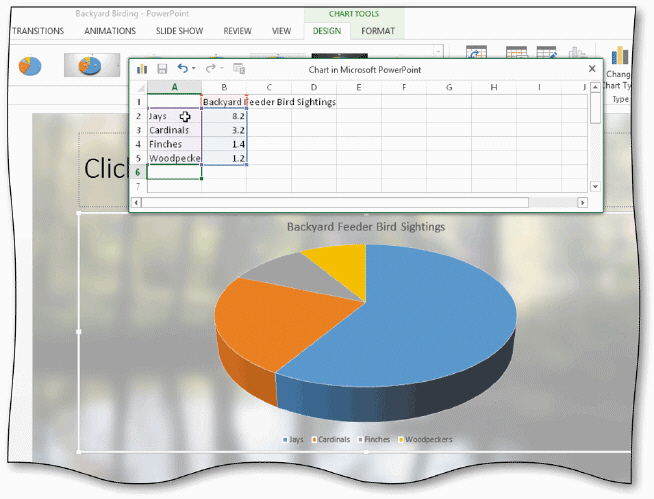 In the accompanying figure, the chart's ____ is/are created from the row titles in the worksheet.
(Multiple Choice)
4.7/5 (34)
An illustration often can help convey relationships between key points in your presentation.
(True/False)
4.8/5 (27)
PowerPoint's default border color is _________________________.
(Short Answer)
4.8/5 (33)
Which of the following SmartArt layout types is used to show proportional relationships with the largest component at the top or bottom?
(Multiple Choice)
4.9/5 (45)
Visual literacy is the ability to examine and assess graphical elements.
(True/False)
4.8/5 (38)
Which of the following chart types divides a single total into parts to illustrate how the segments differ from each other and the whole?
(Multiple Choice)
4.8/5 (37)
To add _________________________ to your slides, you can display text in a nonstandard manner.
(Short Answer)
4.9/5 (31)
Filters
- Essay(0)
- Multiple Choice(0)
- Short Answer(0)
- True False(0)
- Matching(0)