Exam 8: Application: The Costs of Taxation.
Exam 1: Ten Principles of Economics.349 Questions
Exam 2: Thinking Like an Economist.535 Questions
Exam 3: Interdependence and the Gains from Trade.443 Questions
Exam 4: The Market Forces of Supply and Demand.571 Questions
Exam 5: Elasticity and Its Application510 Questions
Exam 6: Supply, Demand, And Government Policies.557 Questions
Exam 7: Consumers, Producers, and the Efficiency of Markets.460 Questions
Exam 8: Application: The Costs of Taxation.424 Questions
Exam 9: Application: International Trade.410 Questions
Exam 10: Externalities.441 Questions
Exam 11: Public Goods and Common Resources.349 Questions
Exam 12: The Design of the Tax System.478 Questions
Exam 13: The Costs of Production.533 Questions
Exam 14: Firms in Competitive Markets.478 Questions
Exam 15: Monopoly.526 Questions
Exam 16: Monopolistic Competition.497 Questions
Exam 17: Oligopoly.410 Questions
Exam 18: The Market For the Factors of Production.463 Questions
Exam 19: Earnings and Discrimination.398 Questions
Exam 20: Income Inequality and Poverty.374 Questions
Exam 21: The Theory of Consumer Choice.462 Questions
Exam 22: Frontiers in Microeconomics.353 Questions
Select questions type
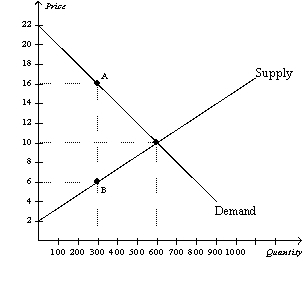
Figure 8-1
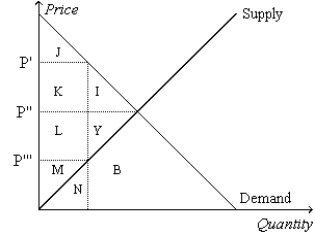 -Refer to Figure 8-1.Suppose the government imposes a tax of P' - P'''.The tax revenue is measured by the area
Free
(Multiple Choice)
4.8/5  (41)
(41)
Correct Answer: Verified
A
When a good is taxed,the burden of the tax
Free
(Multiple Choice)
4.9/5 (38)
Correct Answer:Verified
B
Figure 8-13
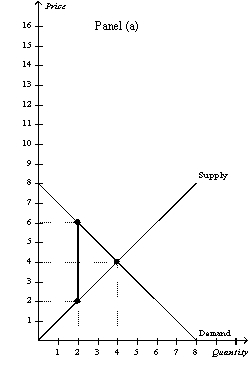
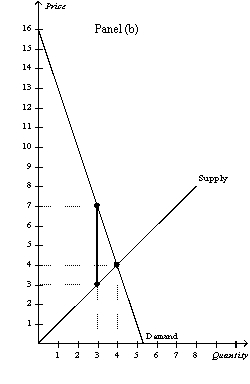 -Refer to Figure 8-13.Panel (a)and Panel (b)each illustrate a $4 tax placed on a market.In comparison to Panel (a),Panel (b)illustrates which of the following statements?
Free
(Multiple Choice)
4.9/5 (35)
Correct Answer:Verified
A
Figure 8-17
The vertical distance between points A and B represents the original tax.
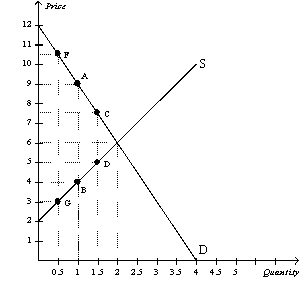 -Refer to Figure 8-17.The original tax can be represented by the vertical distance AB.Suppose the government is deciding whether to lower the tax to CD or raise it to FG.Which of the following statements is not correct?
(Multiple Choice)
4.8/5 (28)
When a good is taxed,the tax revenue collected by the government equals the decrease in the welfare of buyers and sellers caused by the tax.
(True/False)
4.8/5 (32)
Suppose that the government imposes a tax on dairy products.The deadweight loss from this tax will likely be greater in the
(Multiple Choice)
4.8/5 (27)
The more elastic the supply,the larger the deadweight loss from a tax,all else equal.
(True/False)
4.8/5 (37)
When a tax is imposed on the buyers of a good,the demand curve shifts
(Multiple Choice)
4.9/5 (26)
Figure 8-6
The vertical distance between points A and B represents a tax in the market.
 -Refer to Figure 8-6.When the tax is imposed in this market,the price buyers effectively pay is
(Multiple Choice)
4.8/5 (38)
If the tax on gasoline increases from $2 to $4 per gallon,the deadweight loss from the tax increases by a factor of
(Multiple Choice)
4.8/5 (25)
Scenario 8-2
Tom mows Stephanie's lawn for $25. Tom's opportunity cost of mowing Stephanie's lawn is $20, and Stephanie's willingness to pay Tom to mow her lawn is $28.
-Refer to Scenario 8-2.Assume Tom is required to pay a tax of $3 each time he mows a lawn.Which of the following results is most likely?
(Multiple Choice)
4.8/5 (42)
Table 8-1
 -Refer to Table 8-1.Suppose the government is considering levying a tax in one or more of the markets described in the table.Which of the markets will allow the government to minimize the deadweight loss(es)from the tax?
(Multiple Choice)
4.9/5 (32)
When a tax is imposed,the loss of consumer surplus and producer surplus as a result of the tax exceeds the tax revenue collected by the government.
(True/False)
4.8/5 (27)
Figure 8-9
The vertical distance between points A and C represent a tax in the market.
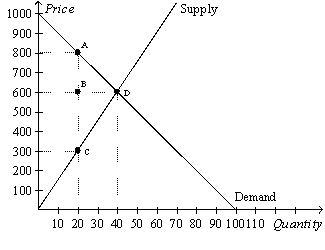 -Refer to Figure 8-9.The equilibrium price and quantity before the imposition of the tax is
(Multiple Choice)
4.8/5 (34)
Figure 8-6
The vertical distance between points A and B represents a tax in the market.
-Refer to Figure 8-6.What happens to consumer surplus when the tax is imposed in this market?
(Multiple Choice)
4.7/5 (33)
Figure 8-1
-Refer to Figure 8-1.Suppose the government imposes a tax of P' - P'''.The consumer surplus before the tax is measured by the area
(Multiple Choice)
4.8/5 (37)
Using demand and supply diagrams,show the difference in deadweight loss between (a)a market with inelastic demand and supply and (b)a market with elastic demand and supply.
(Essay)
4.8/5 (26)
Suppose that a university charges students a $100 "tax" to register for business classes.The next year the university raises the "tax" to $150.The deadweight loss from the "tax" triples.
(True/False)
4.8/5 (34)
Filters
- Essay(0)
- Multiple Choice(0)
- Short Answer(0)
- True False(0)
- Matching(0)