Exam 20: Aggregate Demand and Supply
Exam 1: Introducing the Economic Way of Thinking85 Questions
Exam 2: Production Possibilities Opportunity Cost and Economic Growth107 Questions
Exam 3: Market Demand and Supply176 Questions
Exam 4: Markets in Action137 Questions
Exam 5: Price Elasticity of Demand and Supply151 Questions
Exam 6: Consumer Choice Theory96 Questions
Exam 7: Production Costs131 Questions
Exam 8: Perfect Competition126 Questions
Exam 9: Monopoly81 Questions
Exam 10: Monopolistic Competition and Oligopoly97 Questions
Exam 11: Labor Markets105 Questions
Exam 12: Income Distribution Poverty and Discrimination57 Questions
Exam 13: Antitrust and Regulation96 Questions
Exam 14: Environmental Economics47 Questions
Exam 15: Gross Domestic Product109 Questions
Exam 16: Business Cycles and Unemployment94 Questions
Exam 17: Inflation56 Questions
Exam 18: The Keynesian Model111 Questions
Exam 19: The Keynesian Model in Action105 Questions
Exam 20: Aggregate Demand and Supply94 Questions
Exam 21: Fiscal Policy108 Questions
Exam 22: The Public Sector55 Questions
Exam 23: Federal Deficits Surpluses and the National Debt42 Questions
Exam 24: Money and the Federal Reserve System75 Questions
Exam 25: Money Creation117 Questions
Exam 26: Monetary Policy106 Questions
Exam 27: The Phillips Curve and Expectations Theory59 Questions
Exam 28: International Trade and Finance127 Questions
Exam 29: Economies in Transition46 Questions
Exam 30: Growth and the Less Developed Countries55 Questions
Exam 31: Understanding Direct and Inverse Relationships between Variables172 Questions
Select questions type
The pre-Keynesian or classical economic theory viewed the long-run aggregate supply curve for the economy to be:
(Multiple Choice)
4.9/5  (37)
(37)
The aggregate supply curve will shift to the right when the:
(Multiple Choice)
4.8/5 (46)
In the intermediate range of the aggregate supply curve, if government spending increases caused the aggregate demand curve to shift outwards, which of the following is most likely to occur?
(Multiple Choice)
4.8/5 (28)
Exhibit 10-4 Aggregate supply and demand curves
 In Exhibit 10-4, point E2 represents:
(Multiple Choice)
4.8/5 (35)
The full employment level of real GDP can be represented on an aggregate supply and demand diagram as a(n):
(Multiple Choice)
4.9/5 (38)
Which of the following will not shift the aggregate demand curve to the right?
(Multiple Choice)
4.9/5 (34)
Other factors held constant, a decrease in resource prices will shift the aggregate:
(Multiple Choice)
4.9/5 (42)
Which of the following could not be expected to shift the aggregate demand curve?
(Multiple Choice)
4.8/5 (39)
When the CPI is 300, a real GDP of $8 trillion is demanded in a given year. If the CPI is 250, which of the following could be the real GDP demanded?
(Multiple Choice)
4.9/5 (37)
According to classical theory, if the aggregate demand curve decreased and the economy experienced unemployment, then:
(Multiple Choice)
4.9/5 (29)
When the price level falls, the total quantities of goods and services demanded:
(Multiple Choice)
4.9/5 (43)
Exhibit 10-4 Aggregate supply and demand curves
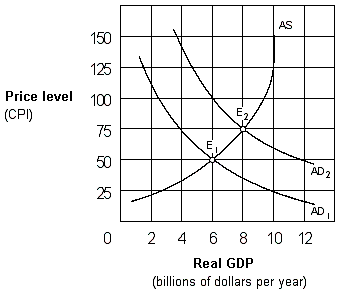 In Exhibit 10-4 which of the following is not consistent with a shift in the aggregate demand curve from AD1 to AD2?
(Multiple Choice)
4.8/5 (35)
Exhibit 10-3 Aggregate supply and demand curves
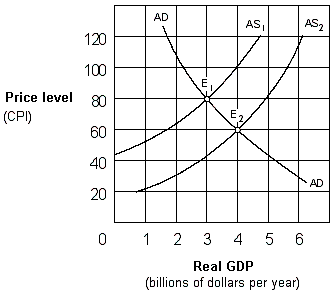 In Exhibit 10-3, the change in equilibrium from E1 to E2 represents:
(Multiple Choice)
4.8/5 (32)
The aggregate demand curve shows how real GDP purchased varies with changes in:
(Multiple Choice)
4.9/5 (29)
Which of the following will most likely cause an increase in the aggregate supply curve?
(Multiple Choice)
4.8/5 (35)
Suppose the economy is on the intermediate range of the aggregate supply curve. Which of the following would reduce both real GDP and the price level?
(Multiple Choice)
4.9/5 (31)
How are demand-pull and cost-push inflation reflected in terms of the AD-AS model?
(Essay)
4.9/5 (33)
When the supply of credit is fixed, an increase in the price level stimulates the demand for credit, which in turn reduces consumption and investment spending. This argument is called the:
(Multiple Choice)
4.8/5 (43)
Filters
- Essay(0)
- Multiple Choice(0)
- Short Answer(0)
- True False(0)
- Matching(0)