Exam 20: Aggregate Demand and Supply
Exam 1: Introducing the Economic Way of Thinking85 Questions
Exam 2: Production Possibilities Opportunity Cost and Economic Growth107 Questions
Exam 3: Market Demand and Supply176 Questions
Exam 4: Markets in Action137 Questions
Exam 5: Price Elasticity of Demand and Supply151 Questions
Exam 6: Consumer Choice Theory96 Questions
Exam 7: Production Costs131 Questions
Exam 8: Perfect Competition126 Questions
Exam 9: Monopoly81 Questions
Exam 10: Monopolistic Competition and Oligopoly97 Questions
Exam 11: Labor Markets105 Questions
Exam 12: Income Distribution Poverty and Discrimination57 Questions
Exam 13: Antitrust and Regulation96 Questions
Exam 14: Environmental Economics47 Questions
Exam 15: Gross Domestic Product109 Questions
Exam 16: Business Cycles and Unemployment94 Questions
Exam 17: Inflation56 Questions
Exam 18: The Keynesian Model111 Questions
Exam 19: The Keynesian Model in Action105 Questions
Exam 20: Aggregate Demand and Supply94 Questions
Exam 21: Fiscal Policy108 Questions
Exam 22: The Public Sector55 Questions
Exam 23: Federal Deficits Surpluses and the National Debt42 Questions
Exam 24: Money and the Federal Reserve System75 Questions
Exam 25: Money Creation117 Questions
Exam 26: Monetary Policy106 Questions
Exam 27: The Phillips Curve and Expectations Theory59 Questions
Exam 28: International Trade and Finance127 Questions
Exam 29: Economies in Transition46 Questions
Exam 30: Growth and the Less Developed Countries55 Questions
Exam 31: Understanding Direct and Inverse Relationships between Variables172 Questions
Select questions type
Exhibit 10-6 Aggregate supply curve
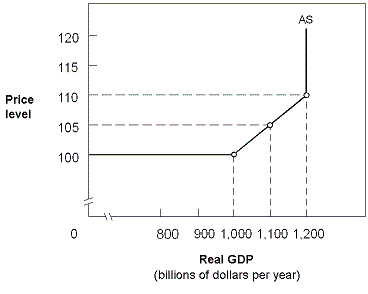 In Exhibit 10-6, when the economy moves from a GDP of $1,000 billion to a GDP of $1,100 billion,
(Multiple Choice)
4.9/5  (27)
(27)
Exhibit 10-7 Aggregate supply and demand curves
 In Exhibit 10-7, if aggregate demand increases from AD1 to AD2,
(Multiple Choice)
4.7/5 (45)
Assuming prices and wages are fully flexible, the aggregate supply curve will be:
(Multiple Choice)
4.8/5 (38)
Exhibit 10-2 Aggregate supply and demand curves
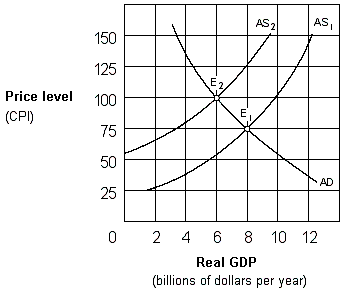 In Exhibit 10-2, the change in equilibrium from E1 to E2 represents:
(Multiple Choice)
4.9/5 (43)
Along the intermediate range of the aggregate supply curve, an increase in the aggregate demand curve will increase:
(Multiple Choice)
4.9/5 (40)
Exhibit 10-4 Aggregate supply and demand curves
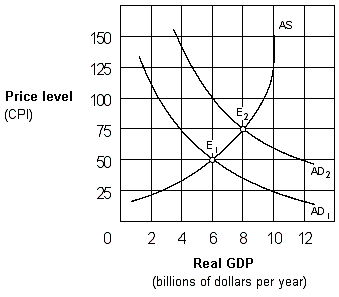 As the economy moves to the right from E1 to E2 in Exhibit 10-4 along the upward-sloping aggregate supply curve the:
(Multiple Choice)
4.7/5 (39)
Which of the following events is the most likely to create stagflation?
(Multiple Choice)
4.8/5 (39)
Aggregate demand's downward-sloping character reflects three principal influences as shown in which of the following?
(Multiple Choice)
4.9/5 (38)
The aggregate demand curve indicates the relationship between:
(Multiple Choice)
4.8/5 (36)
Exhibit 10-1 Aggregate supply curve
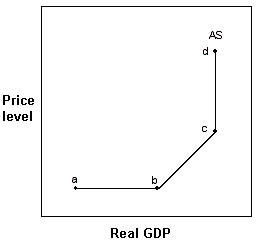 In Exhibit 10-1, higher price levels allow producers to earn higher profits, stimulating production and employment in:
(Multiple Choice)
4.9/5 (41)
Which of the following would shift the aggregate demand curve to the left?
(Multiple Choice)
4.9/5 (32)
Discuss the three ranges of the aggregate supply (AS) curve. What could cause the AS curve to shift to the left? What impact would a leftward shift of the AS curve have on the economy?
(Essay)
4.9/5 (39)
A cut in government spending, a decrease in income abroad, an increase in taxes, or an expectation that future consumer income will fall will all cause aggregate:
(Multiple Choice)
4.8/5 (29)
Exhibit 10-7 Aggregate supply and demand curves
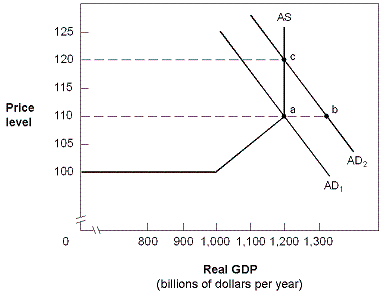 In Exhibit 10-7, the aggregate demand and supply curves reflect an economy in which:
(Multiple Choice)
4.9/5 (45)
Exhibit 10-8 Aggregate demand and supply
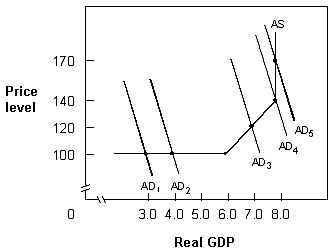 In Exhibit 10-8, when aggregate demand shifts from AD4 to AD5, the economy experiences:
(Multiple Choice)
4.7/5 (34)
Filters
- Essay(0)
- Multiple Choice(0)
- Short Answer(0)
- True False(0)
- Matching(0)