Exam 2: Functions and Graphs
Exam 1: Equations and Inequalities67 Questions
Exam 2: Functions and Graphs88 Questions
Exam 3: Polynomial and Rational Functions79 Questions
Exam 4: Exponential and Logarithmic Functions95 Questions
Exam 5: Trigonometric Functions58 Questions
Exam 6: Trigonometric Identities and Equations25 Questions
Exam 7: Applications of Trigonometry24 Questions
Exam 8: Topics in Analytic Geometry102 Questions
Exam 9: Systems of Equations and Inequalities35 Questions
Exam 10: Matrices29 Questions
Exam 11: Sequences, Series, and Probability66 Questions
Exam 12: Preliminary Concepts63 Questions
Select questions type
The amount of federal income tax  an individual owed in 2004 is given by
 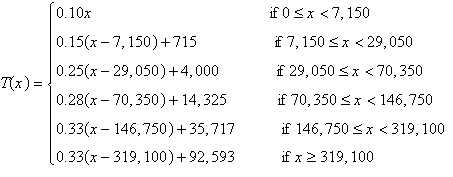 where x is the adjusted gross income tax of the taxpayer. Find the income tax owed by an individual whose adjusted gross income was $58,250.
(Multiple Choice)
4.8/5  (32)
(32)
Find the center and radius of the graph of the circle. The equation of the circle is written in general form. 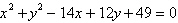
(Multiple Choice)
4.9/5 (38)
The federal minimum wage, in dollars per hour, for the years 1955 to 2005 is given in the table below. Using the data from 1955 and 1995, find a linear model (rounding the slope and intercept to 2 decimal places)that predicts the federal minimum wage for the year t . Use this model to predict in what year the federal minimum wage will exceed $5.80. Year Federal Minimum Wage 1955 0.75 1965 1.25 1975 2.10 1985 3.35 1995 4.25 2005 5.15
(Multiple Choice)
4.9/5 (42)
The fuel efficiency, in miles per gallon, for a certain midsize car at various speeds, in miles per hour, is given in the table below. 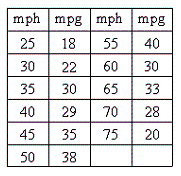 Find a quadratic model for these data.
(Multiple Choice)
4.8/5 (30)
Find the x - and y -intercepts of the graph of the following equation. 
(Multiple Choice)
4.9/5 (36)
Find an equation of a circle that satisfies the following condition. Write your answer in standard form. Center:  ; passing through
(Multiple Choice)
4.9/5 (35)
An air freight company has determined that the cost, in dollars, of delivering x parcels per flight is 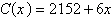 . The price per parcel, in dollars, the company charges to send x parcels is
 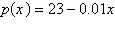 . Determine the minimum number of parcels the air freight company must ship to break even.
(Multiple Choice)
4.8/5 (26)
Use the vertical line test to determine if the following graph is the graph of a function. 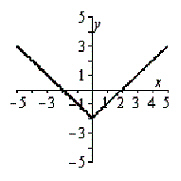
(Multiple Choice)
4.9/5 (39)
The table below shows the velocities, in feet per second, of a ball that is thrown horizontally from the top of a 50 foot building and the distances, in feet, that it lands from the base of the building. Compute the linear regression equation for these data. 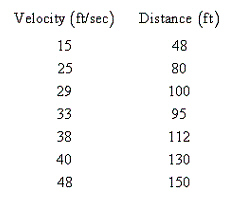
(Multiple Choice)
4.9/5 (33)
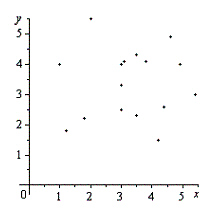
Determine for which scatter diagram, A or B , the coefficient of determination is closer to 1. Diagram A Diagram B 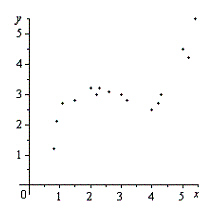
(Multiple Choice)
4.7/5 (28)
An air freight company has determined that the cost, in dollars, of delivering x parcels per flight is 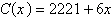 . The price per parcel, in dollars, the company charges to send x parcels is
 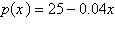 . Determine the revenue function.
(Multiple Choice)
4.9/5 (37)
Determine whether the graph of  is symmetric with respect to the x -axis and/or the y -axis.
(Multiple Choice)
4.9/5 (27)
Use the vertical line test to determine if the following graph is the graph of a function. 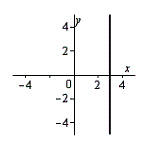
(Multiple Choice)
4.9/5 (30)
The fuel efficiency, in miles per gallon, for a certain midsize car at various speeds, in miles per hour, is given in the table below. 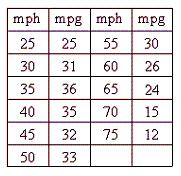 Find a quadratic model for these data and use it to predict the fuel efficiency of this car when it is traveling at a speed of 40 mph. Do not round any values in your calculations but round the final answer to the nearest tenth.
(Multiple Choice)
4.9/5 (23)
Filters
- Essay(0)
- Multiple Choice(0)
- Short Answer(0)
- True False(0)
- Matching(0)