Exam 2: Nonlinear Functions and Models
Exam 1: Functions and Linear Models100 Questions
Exam 2: Nonlinear Functions and Models88 Questions
Exam 3: Introduction to the Derivative140 Questions
Exam 4: Techniques of Differentiation With Applications106 Questions
Exam 5: Further Applications of the Derivative85 Questions
Exam 6: The Integral71 Questions
Exam 7: Further Integration Techniques and Applications of the Integral117 Questions
Exam 8: Functions of Several Variables133 Questions
Exam 9: Trigonometric Models66 Questions
Select questions type
Convert the exponential function to the form indicated. Round all coefficients to four significant digits. 
 = __________ k = __________
(Short Answer)
4.7/5  (26)
(26)
How long, to the nearest year, will it take an investment in Japan to double its value if the interest is compounded every six months? Please round the answer to the nearest year. Country U.S. Japan Canada Korea Australia Yield 5.3% 1.5% 5.2% 5.4% 6.0%
(Multiple Choice)
4.8/5 (30)
There are currently 1,000 cases of Venusian flu in a total susceptible population of 10,000 and the number of cases is increasing by 23% each day. Find a logistic model for the number of cases of Venusian flu and use your model to predict the number of flu cases a week from now. Round your answer to the nearest integer.
(Multiple Choice)
4.9/5 (36)
Convert the exponential function to the form indicated. Round all coefficients to four significant digits. 
(Multiple Choice)
4.7/5 (36)
How long, to the nearest year, will it take an investment in Canada to double its value if the interest is compounded every six months? Please round the answer to the nearest year. Country U.S. Japan Canada Korea Australia Yield 5.3% 1.5% 5.2% 5.4% 6.0% t = __________ year(s)
(Short Answer)
4.9/5 (32)
The following graph shows the actual percentage of U.S. households with a computer as a function of household income (the data points)and a logistic model of these data (the curve). The logistic model is 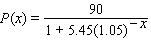 where
where  is the household income in thousands of dollars. For low incomes, the logistic model is approximately exponential. Which exponential model best approximates
  for small
  ? Round the coefficients to the nearest hundredth.
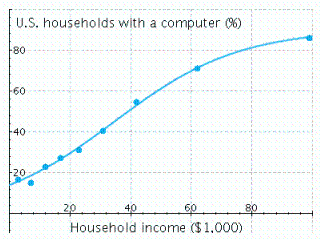
(Multiple Choice)
4.8/5 (26)
The chart shows the number of research articles in the prominent journal Physics Review that were written by researchers in Europe during 1983-2003 (  represents 1983).
 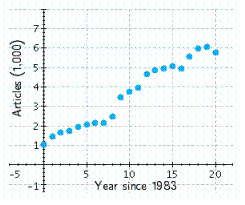 Which of the following logistic functions best models the data? (
  is the number of years since 1983.)Try to determine the correct model without actually computing data points.
(Multiple Choice)
4.9/5 (33)
Filters
- Essay(0)
- Multiple Choice(0)
- Short Answer(0)
- True False(0)
- Matching(0)