Exam 6: The Integral
Exam 1: Functions and Linear Models100 Questions
Exam 2: Nonlinear Functions and Models88 Questions
Exam 3: Introduction to the Derivative140 Questions
Exam 4: Techniques of Differentiation With Applications106 Questions
Exam 5: Further Applications of the Derivative85 Questions
Exam 6: The Integral71 Questions
Exam 7: Further Integration Techniques and Applications of the Integral117 Questions
Exam 8: Functions of Several Variables133 Questions
Exam 9: Trigonometric Models66 Questions
Select questions type
The normal distribution curve which models, distributions of data in a wide range of applications, is given by the function 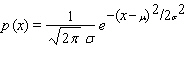 where
where  and
and  and
and  are constants called the standard deviation and the mean, respectively. Its graph is shown in the figure.
 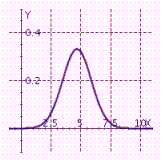 In a survey, consumers were asked to rate a new toothpaste on a scale of 1-10. The resulting data are modeled by a normal distribution with
  and
and  . The percentage of consumers who gave the toothpaste a score between a and b on the section is given by
  . Use a Riemann sum with n = 10 to estimate the percentage of customers who rated the toothpaste 4 or higher. (Use the range 3.5 to 10.5.)
(Multiple Choice)
4.8/5  (37)
(37)
A model rocket has upward velocity 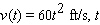 seconds after launch. Use a Riemann sum with n = 10 to estimate how high the rocket is 2 seconds after launch.
(Multiple Choice)
4.8/5 (40)
The marginal cost function for the manufacture of portable CD players is given by 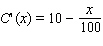 where
where  is the number of CD players manufactured. Use a Riemann sun with n = 15 to estimate the cost of producing the first 15 CD players.
(Multiple Choice)
4.8/5 (46)
A car traveling down a road has a velocity of 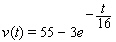 mph at time
  hours. Find the total distance it travels from time
  hours to time
  hours. (Round your answer to the nearest mile.)
(Multiple Choice)
4.8/5 (37)
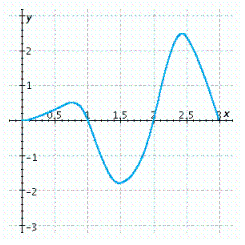
Use the given graph to estimate the left Riemann sum for the given interval with the stated number of subdivisions. 
(Multiple Choice)
4.9/5 (40)
A race car has a velocity of 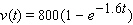 ft/s
ft/s  seconds after starting. Use a Riemann sum with n = 10 to estimate how far the car travels in the first 5 seconds. (Round your answer to the nearest whole number.)
(Multiple Choice)
4.9/5 (37)
Filters
- Essay(0)
- Multiple Choice(0)
- Short Answer(0)
- True False(0)
- Matching(0)