Exam 7: Graphs, Statistics, and Probability
Exam 1: Whole Numbers139 Questions
Exam 2: The Integers75 Questions
Exam 3: Fractions and Mixed Numbers94 Questions
Exam 4: Decimals119 Questions
Exam 5: Ratio, Proportion, and Measurement90 Questions
Exam 6: Percent70 Questions
Exam 7: Graphs, Statistics, and Probability45 Questions
Exam 8: An Introduction to Algebra60 Questions
Exam 9: An Introduction to Geometry100 Questions
Select questions type
Which of the following illustrations represents a circle graph?
Free
(Multiple Choice)
4.9/5  (36)
(36)
Correct Answer: Verified
E
Find the mean of the list of data.
12, 14, 16, 16, 14, 12
Free
(Multiple Choice)
4.8/5 (43)
Correct Answer:Verified
E
Find the mean of the list of data.
46, 62, 42, 32, 85, 57, 96, 104
Free
(Multiple Choice)
4.8/5 (39)
Correct Answer:Verified
D
To study the effect of fluoride in preventing tooth decay, researchers counted the number of fillings in the teeth of 28 patients and recorded these results:
5, 7, 16, 21, 16, 23, 17, 8, 12, 3, 9, 2, 8, 17, 12, 19, 14, 10, 13, 8, 14, 15, 14, 14, 6, 10, 12, 11
Create a table to tally the results.
(Multiple Choice)
4.9/5 (36)
Refer to the pictograph.
How much more money did parents spend than children? 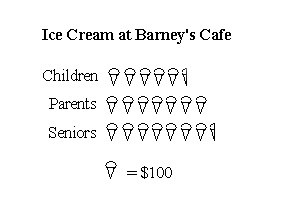
(Multiple Choice)
4.8/5 (37)
Use the following bar graph to find the average number of therms of natural gas used per month. 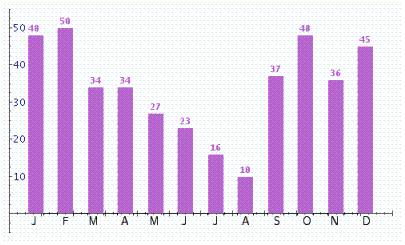
(Short Answer)
4.9/5 (30)
To the nearest two million, how many people in the world speak French?
Is it possible to use circle graphs in this case?
(Multiple Choice)
4.7/5 (28)
Assume that the probability that an airplane engine will fail a test is and that the aircraft in question has 4 engines. What is the sample space for the problem? Use N for not fail and F for fail.
(Short Answer)
4.8/5 (27)
Roberto received the same score on each of five exams, and his mean score is 84. Find his median score and his modal score.
(Multiple Choice)
4.9/5 (35)
Which of the following illustrations is a frequency polygon?
(Multiple Choice)
4.8/5 (32)
What is the event " getting an odd number and a tails " for the experiment of rolling a die and then tossing a coin?
(Multiple Choice)
4.9/5 (30)
Find the mean of the list of data.
48, 67, 44, 37, 80, 52, 92, 108
(Multiple Choice)
4.8/5 (22)
Find the median of the list of data.
0, 0, 4, 7, 0 , 0, 4, 7, 9
(Multiple Choice)
4.8/5 (29)
The class results on a mathematical quiz are shown in the table below. Find the average number of incorrect answers on the quiz.
Total number of incorrect answers on the quiz Number of students 0 4 1 4 2 8 3 10 4 1
(Multiple Choice)
4.9/5 (30)
Which of the following is the sample set for an experiment which involves tossing three coins?
(Multiple Choice)
4.7/5 (37)
Refer to the line graph.
At what times (A, B, C or D) do you find the following conditions: runner 1 running and runner 2 stopped? 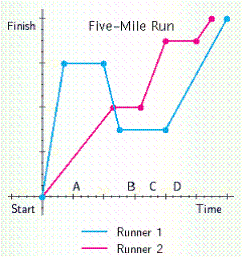
(Multiple Choice)
4.8/5 (40)
Balls numbered from 1 to 38 are placed in a container and stirred. If one is drawn at random, what is the probability that the number is a prime number?
(Multiple Choice)
4.8/5 (28)
Refer to the pie graph that shows the world's languages and the percentages of the population that speak them.
What percentage of the world's population does not speak either Chinese or German? 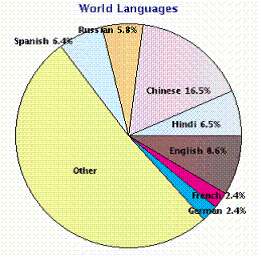
(Multiple Choice)
4.8/5 (32)
Filters
- Essay(0)
- Multiple Choice(0)
- Short Answer(0)
- True False(0)
- Matching(0)