Exam 7: Graphs, Statistics, and Probability
Exam 1: Whole Numbers139 Questions
Exam 2: The Integers75 Questions
Exam 3: Fractions and Mixed Numbers94 Questions
Exam 4: Decimals119 Questions
Exam 5: Ratio, Proportion, and Measurement90 Questions
Exam 6: Percent70 Questions
Exam 7: Graphs, Statistics, and Probability45 Questions
Exam 8: An Introduction to Algebra60 Questions
Exam 9: An Introduction to Geometry100 Questions
Select questions type
What is the event " getting at least one tails " for the experiment of tossing a coin twice?
(Multiple Choice)
4.7/5  (39)
(39)
Find the mode (if any) of the list of data.
16, 16, 18, 18, 16, 17, 18, 16
(Multiple Choice)
4.7/5 (38)
Find the median of the list of data.
15, 18, 20, 29, 34, 44
(Multiple Choice)
4.7/5 (29)
The scores on the first exam of the students in a history class were 52, 57, 63, 62, 62, 62, 84, 82, 98, 91, and 100. Kia got a score of 85 and claims that "85 is better than average." Which of the three measures of central tendency is she better than: the mean, the median, or the mode?
(Multiple Choice)
4.8/5 (30)
List the sample set for an experiment which involves picking a one-digit number.
(Multiple Choice)
4.8/5 (32)
If the symbol  = 1,800 cars, estimate what the symbol
  represents.
(Multiple Choice)
4.7/5 (30)
Several groceries reported differing prices for a bread. The prices are as follows: 2.3, 2.6, 3.2, 2.8, 3.1, 3, 2.2, 2, 2.8. Find the mean, median, and mode of the prices for a bread. Then find the range of the prices.
(Multiple Choice)
4.9/5 (36)
How many more pet cats are there than pet dogs?
Is it possible to use bar graphs in this case?
(Multiple Choice)
4.9/5 (31)
Frank's algebra grade is based on the average of four exams, which will count equally. His grades are 85, 70, 70 and 85. Find his average.
(Multiple Choice)
4.8/5 (34)
The magnitudes of the major earthquakes in 1999 are listed below.
1/19/99 New Ireland, Papua New Guinea 7 2/6/99 Santa Cruz Islands, S.Pacific Sea 7.3 3/4/99 Celebes Sea, Indonesia 7.1 4/5/99 New Britain, Papua New Guinea 7.4 4/8/99 E.Russia/N.E.China border 7.1 5/10/99 New Britain, Papua New Guinea 7.1 5/16/99 New Britain, Papua New Guinea 7.1 8/17/99 Izmit region, western Turkey 7.4 9/21/99 Taiwan 7.8 9/30/99 Oaxaca, Mexico 7.4 11/12/99 Bolu Province, northwest Turkey 7.2
Find the mean, median, and mode of the magnitudes. Round to the nearest tenth.
(Multiple Choice)
4.8/5 (38)
Several computer stores reported differing prices for a toner cartridge for a laser printer. The prices are as follows: 59, 50, 77, 70, 71, 73, 54, 56, 70. Find the mode of the prices for a toner cartridge.
(Multiple Choice)
4.7/5 (27)
Find the weighted mean of a set of values. Round to the nearest tenth. Value of x The weights to the x values 3 20 4 34 2 47 1 54
(Multiple Choice)
4.8/5 (37)
Refer to the following spinner. If the spinner is spun, what is the probability that the arrow will stop on green? Assume that the spinner never stops on a line. 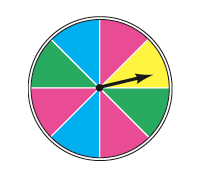
(Multiple Choice)
4.8/5 (29)
Use the data in the table to make a line graph showing the average acreage (in acres) of U.S. farms for the years 1950 through 1990.
Year Number of U.S. farms (in millions) Average size of U.S. farms (acres) 1950 5.6 214 1960 4.0 330 1970 2.9 399 1980 2.4 441 1990 2.1 478 2000 2.2 439
(Multiple Choice)
4.9/5 (43)
Raul has an adjusted income of $153,850, is married, and files jointly. Compute his tax.
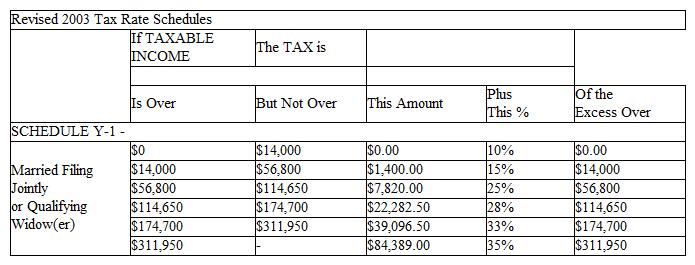
(Multiple Choice)
4.8/5 (45)
Find the semester grade point average for a student that received the following grades. Round to the nearest hundredth.
Course Grade Credits Mathematics C 2 English D 1 History C 3 Geography D 3 Biology B 3
(Multiple Choice)
4.8/5 (40)
Match the type of information with the most appropriate kinds of presentations.
Correct Answer: Verified
Premises:
Responses:
(Matching)
4.8/5 (38)
Filters
- Essay(0)
- Multiple Choice(0)
- Short Answer(0)
- True False(0)
- Matching(0)