Exam 7: Graphs, Statistics, and Probability
Exam 1: Whole Numbers139 Questions
Exam 2: The Integers75 Questions
Exam 3: Fractions and Mixed Numbers94 Questions
Exam 4: Decimals119 Questions
Exam 5: Ratio, Proportion, and Measurement90 Questions
Exam 6: Percent70 Questions
Exam 7: Graphs, Statistics, and Probability45 Questions
Exam 8: An Introduction to Algebra60 Questions
Exam 9: An Introduction to Geometry100 Questions
Select questions type
An ordinary die is rolled once. What is the probability of rolling an even number?
(Multiple Choice)
4.9/5  (39)
(39)
Use the data in the table to make a line graph showing the average acreage (in acres) of U.S. farms for the years 1950 through 1990.
Year Number of U.S. farms (in millions) Average size of U.S. farms (acres) 1950 5.6 234 1960 4.0 330 1970 2.9 399 1980 2.4 441 1990 2.1 478 2000 2.2 439
(Multiple Choice)
4.8/5 (32)
Refer to the line graph.
In approximately what year did miners begin to earn more than construction workers? 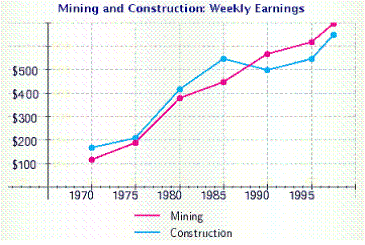
(Multiple Choice)
4.9/5 (29)
Which of the following illustrations best represents a bar graph?
(Multiple Choice)
4.9/5 (33)
What is the event " getting numbers, whose sum is more then 6 " for the experiment of rolling a die twice?
(Multiple Choice)
4.7/5 (38)
Filters
- Essay(0)
- Multiple Choice(0)
- Short Answer(0)
- True False(0)
- Matching(0)