Exam 1: Building Blocks of Algebra
Exam 1: Building Blocks of Algebra379 Questions
Exam 2: Linear Equations and Inequalities With One Variable241 Questions
Exam 3: Linear Equations With Two Variables340 Questions
Exam 4: Systems of Linear Equations278 Questions
Exam 5: Exponents and Polynomials262 Questions
Exam 6: Factoring and Quadratic Equations288 Questions
Exam 7: Rational Expressions and Equations271 Questions
Exam 8: Radical Expressions and Equations237 Questions
Exam 9: Modeling Data74 Questions
Select questions type
Translate the phrase into an algebraic expression.
92 less than y
(Multiple Choice)
4.8/5  (29)
(29)
35% of the pets in the town are cats. There are 320 pets total in town. How many are cats?
(Multiple Choice)
4.9/5 (34)
Consider the function f(x) = 4 x  7. What is the name of the function? What is the input? What is the output?
(Multiple Choice)
4.8/5 (28)
The following table shows data for the cost of humidifiers based on the number of humidifiers produced. Find a linear model for the cost C of producing x humidifiers. 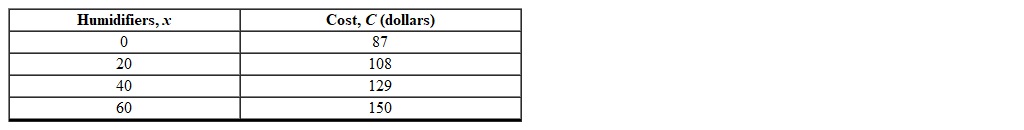
(Multiple Choice)
4.7/5 (38)
Does the equation y = -3 x define the variable y as a function of the variable x ?
(Multiple Choice)
4.8/5 (27)
The table below describes the average temperatures for Portland OR during a given year. What is the median temperature for the year? 
(Multiple Choice)
4.7/5 (29)
When you add two fractions with different denominators you must find a common denominator.
(True/False)
4.8/5 (32)
A submarine was cruising 250 m below the surface of the water. It began to rise toward the surface at 25 m per minute. After 5 minutes what was its depth below the surface?
(Multiple Choice)
4.9/5 (44)
The mass of bacteria (in micrograms) in a Petri dish for different times is shown in the table below. What is the mass of the bacteria (in mcg) at 9:30 am? 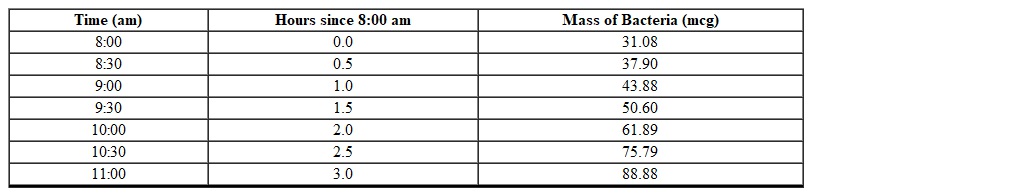
(Multiple Choice)
4.8/5 (38)
The resistance R of a wire (in ohms) is related to its length L (in meters) and its diameter d (in meters) by the formula  . Find a formula for d .
(Multiple Choice)
4.8/5 (40)
A population of rabbits was tracked over a 55-day period. The data is shown in the following graph. How did the population of rabbits change between day 3 and day 20? 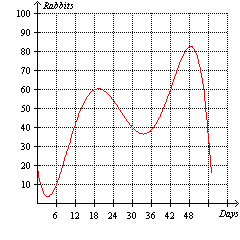
(Multiple Choice)
4.7/5 (31)
Filters
- Essay(0)
- Multiple Choice(0)
- Short Answer(0)
- True False(0)
- Matching(0)