Exam 1: Data, Functions, and Models
Exam 1: Data, Functions, and Models81 Questions
Exam 2: Linear Functions and Models70 Questions
Exam 3: Exponential Functions and Models110 Questions
Exam 4: Logarithmic Functions and Exponential Modela74 Questions
Exam 5: Quadratic Functions and Models73 Questions
Exam 6: Power, Polynomial, and Rational Functions71 Questions
Exam 7: Systems of Equations and Data in Categories71 Questions
Select questions type
The table below describes the average temperatures for Portland, OR during a given year. What is the median temperature for the year?

(Multiple Choice)
4.8/5  (33)
(33)
The following table shows data for the cost of humidifiers based on the number of humidifiers produced. Find a linear model for the cost C of producing x humidifiers.
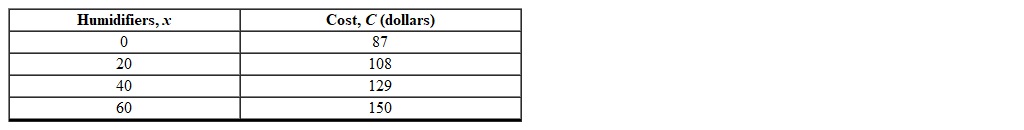
(Multiple Choice)
4.9/5 (47)
Use the following graph to create an algebra model for the function. 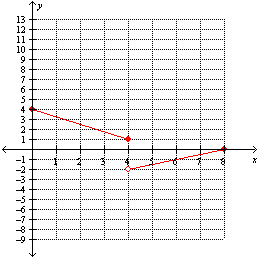
(Multiple Choice)
4.8/5 (44)
Given the table below, is the variable y a function of the variable x ?

(True/False)
4.8/5 (39)
A membership to a local fitness club costs $49 per month. The membership includes 20 hours of use of the club. If you want to use the club more than 20 hours per month, it will cost an additional $1.80 per hour. Let C represent the cost of the membership and x represent the number of hours of use of the club. Find and interpret  .
.
(Multiple Choice)
4.7/5 (35)
A population of rabbits was tracked over a 55-day period. The data is shown in the following graph. What was the approximate number of rabbits on day 30? 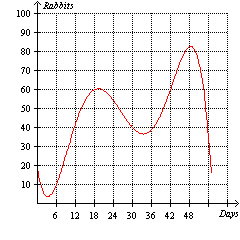
(Multiple Choice)
4.9/5 (36)
The price per gallon of gas at various gas stations around town is listed in the table below. What is the average price per gallon? (Rounded to the nearest hundredth)

(Multiple Choice)
4.8/5 (37)
If the net change of a function f from a to b is negative, then the function must steadily increase from a to b .
(True/False)
4.7/5 (41)
Given the table below, is the variable y a function of the variable x ?

(True/False)
4.9/5 (44)
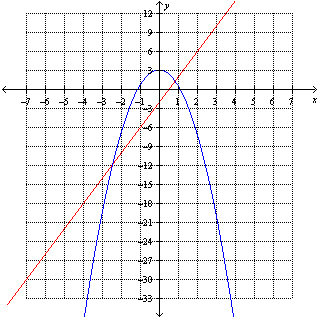
The graphs of  and
and 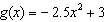 are shown below. Find the value(s) of x for which
  .
. 
(Multiple Choice)
4.9/5 (42)
Does the equation x = ( y  6)
6)  + 3 define the variable y as a function of the variable x ?
(True/False)
4.9/5 (32)
Which of the following formulas express the average score for 4 exams?
(Multiple Choice)
4.8/5 (30)
The distance d (in miles) that a car travels based on the amount of time t (in seconds) is given by the equation d = 3 t 
 2 t . What is the net change in distance d when the time t changes from 0 to 2 seconds?
(Multiple Choice)
4.8/5 (29)
For the function 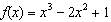 , find the intervals on which
  is increasing.
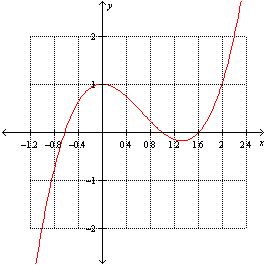
(Multiple Choice)
4.8/5 (31)
The following table shows the values of airfare for a roundtrip ticket from San Antonio, TX to Portland, OR.
 Which one of the following scatterplots illustrates this data?
(Multiple Choice)
4.8/5 (30)
Filters
- Essay(0)
- Multiple Choice(0)
- Short Answer(0)
- True False(0)
- Matching(0)