Exam 3: Exponential Functions and Models
Exam 1: Data, Functions, and Models81 Questions
Exam 2: Linear Functions and Models70 Questions
Exam 3: Exponential Functions and Models110 Questions
Exam 4: Logarithmic Functions and Exponential Modela74 Questions
Exam 5: Quadratic Functions and Models73 Questions
Exam 6: Power, Polynomial, and Rational Functions71 Questions
Exam 7: Systems of Equations and Data in Categories71 Questions
Select questions type
The number of cell phone users at time t (in years) is modeled by 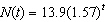 . Which one of the following models the number of cell phone users for a one-month growth factor?
(Multiple Choice)
4.8/5  (27)
(27)
Which one of the following scenarios does NOT describe exponential growth?
(Multiple Choice)
4.9/5 (35)
Using the following table of a function that models exponential decay, determine the one-month decay factor (rounded to the nearest thousandth). 
(Multiple Choice)
4.9/5 (30)
Atmospheric pressure (measured in atm) decreases by 11.5% for every 1000-meter increase in elevation. At sea level, the atmospheric pressure is 1 atm. What is the 8,000-meter decay factor for the atmospheric pressure (rounded to the nearest thousandth)?
(Multiple Choice)
4.9/5 (33)
Atmospheric pressure (measured in atm) decreases by 11.5% for every 1000-meter increase in elevation. At sea level, the atmospheric pressure is 1 atm. What is the atmospheric pressure at 8,000 meters above sea level (rounded to the nearest thousandth)?
(Multiple Choice)
4.8/5 (33)
After college graduation, Sheena was offered two different jobs. The first offer included a salary of $40,300 plus a guaranteed raise of $1100 per year. The second offer included a salary of $29,000 plus a guaranteed raise of 3% per year.
Use the first job offer to find a function f that models the salary t years from now.
(Essay)
4.9/5 (30)
The number of tourists in a small town at time t (in years) is modeled by 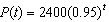 . What is the initial number of tourists?
(Multiple Choice)
4.9/5 (32)
Using the following table of a function that models exponential growth, determine which one of the following models the population as a function of time. 
(Multiple Choice)
4.9/5 (36)
A lake is initially stocked with 500 turtles and the turtle population is sampled at 8-week intervals to estimate the population size. The table illustrates the data gathered from the sampling.
 Using a graphing calculator, find an appropriate curve that models the turtle population as a function of the number of weeks (round to the nearest thousandth).
(Essay)
4.8/5 (31)
Which one of the following functions is described by the graph? 
(Multiple Choice)
5.0/5 (29)
The population of Arizona was 5.1 million in 2000 and 7.7 million in 2008. If the population grew linearly, which one of the following models the population as a function of time (in years since 2000)?
(Multiple Choice)
4.8/5 (39)
Using the graph below, find the percentage rate of change from  to
to  .
. 
(Multiple Choice)
4.8/5 (30)
Using the following table of a function that models exponential growth, determine the one-year growth factor (rounded to the nearest thousandth). 
(Multiple Choice)
4.7/5 (35)
The function  is a model for a population A, where t is measured in years. The function
 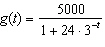 is a model for a population B, where t is measured in years. True or false?
-The function f(t) grows linearly.
is a model for a population B, where t is measured in years. True or false?
-The function f(t) grows linearly.
(True/False)
4.8/5 (38)
The population of Smallville at time t (in years) is modeled by 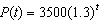 . What is the growth rate (in percentage form)?
(Multiple Choice)
4.9/5 (35)
The amount of caffeine (in milligrams) left in an adult body t hours after drinking a 16 oz. coke is modeled by  . What is the initial population?
(Multiple Choice)
4.8/5 (32)
The number of bacteria present in a Petri dish at time t (in minutes) is modeled by 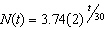 . Which one of the following models the population for a one-hour growth factor?
(Multiple Choice)
4.9/5 (41)
In 1990, a town s population was 24,127. In 1998, the town s population increased to 33,887. Assuming that the population increased exponentially from 1990-1998, this data can be modeled by 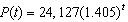 where t is the number of years since 1990.
(True/False)
4.9/5 (33)
Filters
- Essay(0)
- Multiple Choice(0)
- Short Answer(0)
- True False(0)
- Matching(0)