Exam 3: Exponential Functions and Models
Exam 1: Data, Functions, and Models81 Questions
Exam 2: Linear Functions and Models70 Questions
Exam 3: Exponential Functions and Models110 Questions
Exam 4: Logarithmic Functions and Exponential Modela74 Questions
Exam 5: Quadratic Functions and Models73 Questions
Exam 6: Power, Polynomial, and Rational Functions71 Questions
Exam 7: Systems of Equations and Data in Categories71 Questions
Select questions type
The model 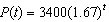 describes the population of Town A. Which one of the following written statements best describes this population?
(Multiple Choice)
4.9/5  (41)
(41)
Which one of the following functions is described by the graph? 
(Multiple Choice)
4.9/5 (36)
The value of an investment doubles every 32 months. If the investment starts with $3700, how much money is in the investment after 3 months (rounded to the nearest hundredth)?
(Multiple Choice)
4.8/5 (39)
The model 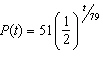 describes the amount of Cesium-137 remaining after t years. Which one of the following written statements best describes the behavior of Cesium-137?
(Multiple Choice)
4.9/5 (24)
Using the graph below, find the average rate of change from  to
to  (rounded to the nearest tenth)?
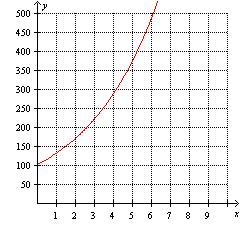
(Multiple Choice)
4.7/5 (41)
The revenue of a company is being monitored each month. The initial revenue is $1.3 million. The table illustrates the data gathered over a 6-month time period.
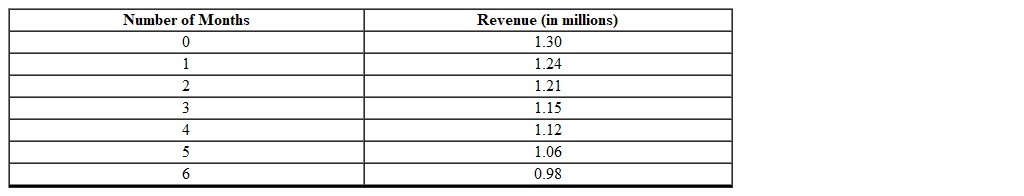 Using a graphing calculator, find an appropriate curve that models the revenue as a function of the number of months (round to the nearest thousandth).
(Essay)
4.9/5 (31)
The percent rate of change for the increase in bees per day for time 0 to 2 days is 7.46%.

(True/False)
4.9/5 (42)
Which one of the following scenarios does not describe exponential decay?
(Multiple Choice)
4.9/5 (34)
The average rate of change for the increase in bees per day for time 0 to 2 days is 4.02. 
(True/False)
4.8/5 (39)
Using the following table of a function that models exponential decay, determine the 3-year decay factor (rounded to the nearest thousandth). 
(Multiple Choice)
4.8/5 (37)
Using the following table of a function that models exponential decay, determine the one-year decay factor (rounded to the nearest hundredth). 
(Multiple Choice)
4.9/5 (39)
The function  is a model for the number of cars allowed in a parking lot during a special event, where t is measured in hours. What is the initial value for the function f ?
(Multiple Choice)
4.8/5 (41)
A region in the Arizona desert has 351 rabbits, and after 3 months there are 896 rabbits. Assuming that the number of rabbits grows exponentially, which of the following is the 3-month growth factor (rounded to the nearest tenth)?
(Multiple Choice)
4.9/5 (25)
The graph of a function that models exponential growth is shown. What is the initial population? 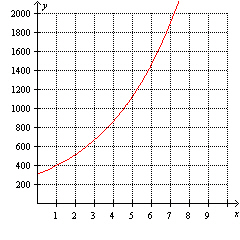
(Multiple Choice)
4.9/5 (22)
A town starts with 200 people and declines by 28% per year, with x representing the number of years. Which of the following functions model this behavior?
(Multiple Choice)
4.9/5 (35)
The function  is a model for a population A, where t is measured in years. The function
 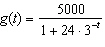 is a model for a population B, where t is measured in years. True or false?
-The population of g(t) after 4 years exceeds the carrying capacity for the logistic function.
is a model for a population B, where t is measured in years. True or false?
-The population of g(t) after 4 years exceeds the carrying capacity for the logistic function.
(True/False)
4.8/5 (39)
The amount of caffeine (in milligrams) left in an adult body t hours after drinking a 16 oz. coke is modeled by  . What is the decay factor?
(Multiple Choice)
4.8/5 (37)
The model 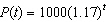 describes the amount of bacteria in a Petri dish after t hours. Which one of the following written statements best describes this population?
(Multiple Choice)
4.9/5 (30)
A bacterial infection starts with 92 bacteria, with the bacteria count doubling every 6-hour time period. Which of the following exponential growth models represent the number of bacteria x hours after infection?
(Multiple Choice)
4.9/5 (34)
Filters
- Essay(0)
- Multiple Choice(0)
- Short Answer(0)
- True False(0)
- Matching(0)