Exam 12: Sampling Distributions, Sampling Distribution of the Mean: the Normal Deviate Z Test
Exam 1: Statistics and Scientific Method102 Questions
Exam 2: Basic Mathematical and Measurement Concepts110 Questions
Exam 3: Frequency Distributions116 Questions
Exam 4: Measures of Central Tendency and Variability125 Questions
Exam 5: The Normal Curve and Standard Scores105 Questions
Exam 6: Correlation139 Questions
Exam 7: Linear Regression101 Questions
Exam 8: Random Sampling and Probability123 Questions
Exam 9: Binomial Distribution121 Questions
Exam 10: Introduction to Hypothesis Testing: Using the Sign Test141 Questions
Exam 11: Power103 Questions
Exam 12: Sampling Distributions, Sampling Distribution of the Mean: the Normal Deviate Z Test135 Questions
Exam 13: Students T Test for Single Samples121 Questions
Exam 14: Students T Test for Correlated and Independent Groups145 Questions
Exam 15: Introduction to the Analysis of Variance218 Questions
Exam 16: Introduction to the Two-Way Analysis of Variance115 Questions
Exam 17: Chi-Square and Other Nonparametric Tests170 Questions
Select questions type
The sampling distribution of the mean is always normally distributed.
(True/False)
4.7/5  (47)
(47)
For the z test, the critical region for rejection of H 0 _________.
(Multiple Choice)
5.0/5 (34)
Define the critical region and the critical values of a statistic.
(Short Answer)
4.8/5 (40)
Assume the following values of s have been obtained for different Null Hypothesis Populations. Calculate the value of the standard error of the mean for samples of size N taken from the respective populations. 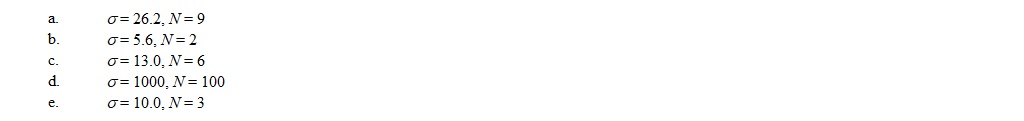
(Not Answered)
This question doesn't have any answer yet
The normal deviate test uses the mean of the sample as a basic statistic.
(True/False)
4.7/5 (36)
A computer memory manufacturer specifies that its memory chip stores data incorrectly an average of 6.3 out of 10 million cycles with a standard deviation of 0.48. A batch of 30 chips your company ordered stores data incorrectly an average of 6.9 times per 10 million cycles. 
(Not Answered)
This question doesn't have any answer yet
The average weight of a species of laboratory rats at birth is 27.6 grams with a standard deviation of 3.4 grams. You wish to test the hypothesis that a different maternal feeding cycle but the same quantity and quality will affect birth-weight. A sample of 10 female rats given the new feeding schedule gave birth to 56 baby rat pups with an average weight of 25.9 grams. 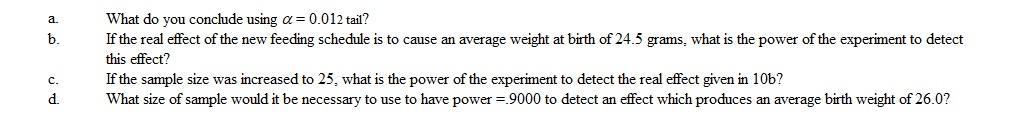
(Not Answered)
This question doesn't have any answer yet
A sampling distribution gives one the values a statistic can take, along with the probability of getting each value if sampling is random from the H1 population.
(True/False)
4.7/5 (33)
Referring to question 29, if N is increased to 90, power = _________ to detect a real effect such that µ real = 53.
(Multiple Choice)
4.9/5 (41)
The average life of a light bulb is 862 hours with a standard deviation of 51 hours. A new manufacturing process results in a sample of 24 bulbs with a mean life of 899 hours until burn out. 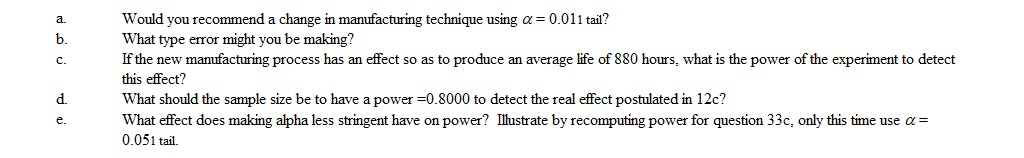
(Not Answered)
This question doesn't have any answer yet
Generally speaking, if the sampling distribution of a statistic is indeterminate (impossible to determine), the statistic cannot be used for inference.
(True/False)
4.8/5 (39)
Explain the process of generating sampling distributions using the empirical approach.
(Essay)
4.9/5 (43)
A set of sample scores from an experiment has an N = 28 and a mean = 52. H 1 is directional, predicting an effect of the independent variable which decreases the magnitude of the dependent variable. H 0 asserts the sample is a random sample from a population of scores where µ = 55 and s = 12. a = 0.051 tail. Using the z test to analyze the data, what is the correct conclusion regarding H 0 ?
(Multiple Choice)
4.8/5 (43)
In a population with = 100 and s = 15, what is the probability if we randomly drew a sample of N = 9 we would get a value of  108?
108?
(Not Answered)
This question doesn't have any answer yet
By using a stringent alpha level, and designing the experiment for high power, we maximize the probability of correctly concluding regardless of whether H0 is true or false.
(True/False)
4.8/5 (36)
The sampling distribution of the mean is made up of mean scores.
(True/False)
4.9/5 (35)
A raw score distribution which has a moderate negative skew will result in a sampling distribution of the mean for N = 42 that is _________.
(Multiple Choice)
4.8/5 (37)
The critical value for the z distribution using a = 0.05 2 tail is _________.
(Multiple Choice)
4.8/5 (31)
The binomial distribution is an example of a sampling distribution.
(True/False)
5.0/5 (37)
Is it always the case for both directional and nondirectional H 1s that if z obt ?5= z crit, the correct conclusion is to reject H 0? Explain.
(Essay)
4.7/5 (43)
Filters
- Essay(0)
- Multiple Choice(0)
- Short Answer(0)
- True False(0)
- Matching(0)