Exam 12: Sampling Distributions, Sampling Distribution of the Mean: the Normal Deviate Z Test
Exam 1: Statistics and Scientific Method102 Questions
Exam 2: Basic Mathematical and Measurement Concepts110 Questions
Exam 3: Frequency Distributions116 Questions
Exam 4: Measures of Central Tendency and Variability125 Questions
Exam 5: The Normal Curve and Standard Scores105 Questions
Exam 6: Correlation139 Questions
Exam 7: Linear Regression101 Questions
Exam 8: Random Sampling and Probability123 Questions
Exam 9: Binomial Distribution121 Questions
Exam 10: Introduction to Hypothesis Testing: Using the Sign Test141 Questions
Exam 11: Power103 Questions
Exam 12: Sampling Distributions, Sampling Distribution of the Mean: the Normal Deviate Z Test135 Questions
Exam 13: Students T Test for Single Samples121 Questions
Exam 14: Students T Test for Correlated and Independent Groups145 Questions
Exam 15: Introduction to the Analysis of Variance218 Questions
Exam 16: Introduction to the Two-Way Analysis of Variance115 Questions
Exam 17: Chi-Square and Other Nonparametric Tests170 Questions
Select questions type
You have just read that chickens have a relatively low level of body fat. The population mean percentage of fat in a chicken is reported to be 32% with the standard deviation of 8.7%. How likely is it that you could randomly select a sample of 12 chickens from the population that would have a mean of 26% body fat or less?
(Short Answer)
5.0/5  (34)
(34)
Referring to question 29, the probability of making a Type II error is _________.
(Multiple Choice)
4.8/5 (34)
What is the critical value for z for each of the following alpha levels?
(Not Answered)
This question doesn't have any answer yet
If z obt falls within the critical region for rejection of H0 , one can be certain H0 is in reality false.
(True/False)
4.9/5 (45)
If the variability of the raw score population increases and N is held constant,  _________.
(Multiple Choice)
4.8/5 (36)
The critical value for the z distribution using a = 0.01 2 tail is _________.
(Multiple Choice)
4.8/5 (42)
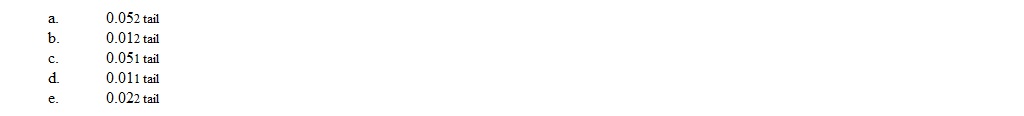
A set of sample scores from an experiment has an N = 28 and a mean = 52. H 1 is directional, predicting an effect of the independent variable which decreases the magnitude of the dependent variable. H 0 asserts the sample is a random sample from a population of scores where µ = 55 and s = 12. a = 0.051 tail. Using the z test to analyze the data, z crit = _________.
(Multiple Choice)
4.8/5 (29)
 is sometimes called the standard error of the mean because each sample can be considered an estimate of the mean of the raw score population and variability between sample means occur due to errors in estimation.
(True/False)
4.8/5 (39)
An English teacher has been teaching a sixth grade composition class for many years. He has the feeling that over the past several years, the writing ability of students has changed. A national test of proficiency in composition was administered 5 years ago. The resulting distribution of scores was normally shaped, had a mean of 85 and a standard deviation of 10.9. In order to test his feeling, he gives his present class of 43 students the same proficiency test. The resulting mean is 80 and the standard deviation is 8.7. The obtained value of the appropriate statistic for testing H 0 is _________.
(Multiple Choice)
4.7/5 (35)
The critical region for rejection of H 0 is the area under the curve that contains all the values of the statistic that fail to allow rejection of H 0 .
(True/False)
4.9/5 (34)
Power is independent of the magnitude of the independent variable's effect.
(True/False)
4.8/5 (26)
The mean attention span for adults in a certain village is 15 minutes with a standard deviation of 6.4. The mean of all possible samples of size 30, taken from that population equals _________.
(Multiple Choice)
4.9/5 (35)
If one draws all possible samples for various values of N from the same population of raw scores, as N increases _________.
(Multiple Choice)
4.8/5 (35)
Filters
- Essay(0)
- Multiple Choice(0)
- Short Answer(0)
- True False(0)
- Matching(0)