Exam 8: Analyzing Inequalities in Education
Exam 1: An Introduction to Analyzing Inequalities10 Questions
Exam 2: Understanding Data: Critical Concepts10 Questions
Exam 3: Analyzing Gender With the GSS10 Questions
Exam 4: Analyzing Race and Ethnicity With the GSS10 Questions
Exam 5: Analyzing Class With the GSS10 Questions
Exam 6: Analyzing Sexuality With the GSS10 Questions
Exam 7: Analyzing Inequalities in Families10 Questions
Exam 8: Analyzing Inequalities in Education10 Questions
Exam 9: Analyzing Inequalities in the Economy and at Work10 Questions
Select questions type
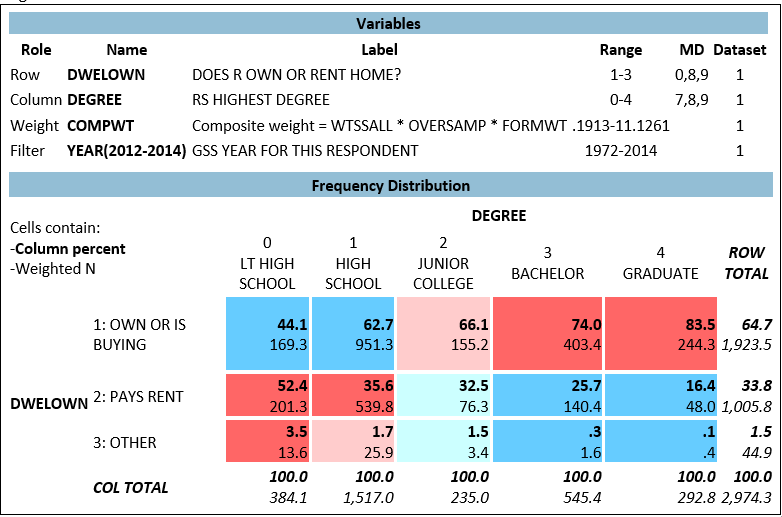 A team of researchers is interested to know whether educational attainment affects the likelihood of owning or renting a home. They create a cross-tab with DWELOWN (Do you/Does your family) own your (home/apartment), pay rent, or what?") and DEGREE (respondents' highest educational degree), using a filter of "YEAR (2010-2014)." Figure 8.1 shows the resulting analysis.
-In general, as respondents' educational attainment increases, the percentage of those who say they "pay rent" for their current home:
A team of researchers is interested to know whether educational attainment affects the likelihood of owning or renting a home. They create a cross-tab with DWELOWN (Do you/Does your family) own your (home/apartment), pay rent, or what?") and DEGREE (respondents' highest educational degree), using a filter of "YEAR (2010-2014)." Figure 8.1 shows the resulting analysis.
-In general, as respondents' educational attainment increases, the percentage of those who say they "pay rent" for their current home:
Free
(Multiple Choice)
4.8/5  (38)
(38)
Correct Answer: Verified
A
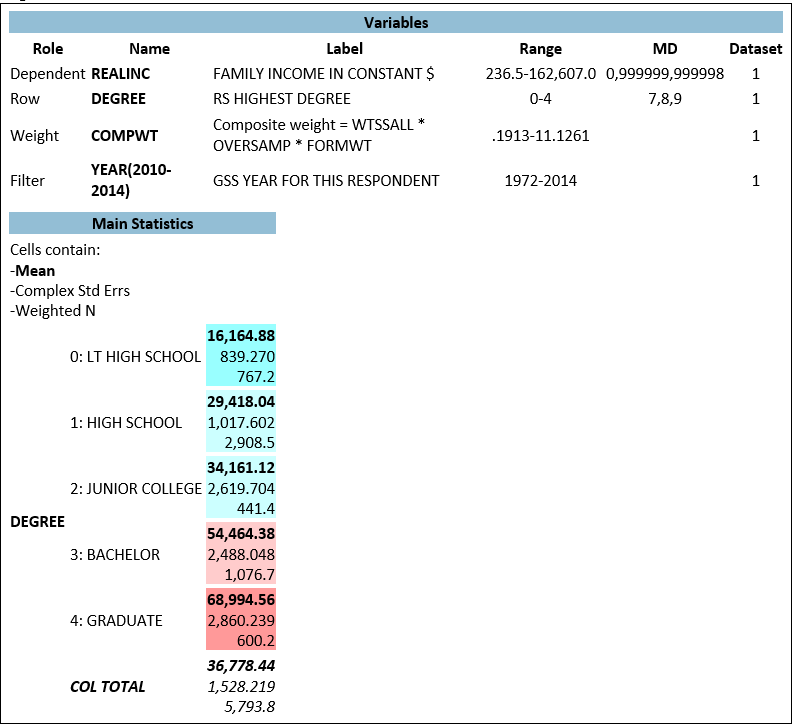 A team of researchers is interested to know whether respondents' education is related to their personal income. They conduct a comparison of means with the variable REALINC (Respondent's personal annual income, measured in dollars) as the dependent variable and DEGREE as the "Row" variable, and use a filter of YEAR (2010-2014). The resulting analysis is shown in Figure 8.2
-Which of the following statements is true, based on Figure 8.2?
A team of researchers is interested to know whether respondents' education is related to their personal income. They conduct a comparison of means with the variable REALINC (Respondent's personal annual income, measured in dollars) as the dependent variable and DEGREE as the "Row" variable, and use a filter of YEAR (2010-2014). The resulting analysis is shown in Figure 8.2
-Which of the following statements is true, based on Figure 8.2?
Free
(Multiple Choice)
4.8/5 (34)
Correct Answer:Verified
B
A team of researchers is interested to know whether educational attainment affects the likelihood of owning or renting a home. They create a cross-tab with DWELOWN (Do you/Does your family) own your (home/apartment), pay rent, or what?") and DEGREE (respondents' highest educational degree), using a filter of "YEAR (2010-2014)." Figure 8.1 shows the resulting analysis.
-What percentage of respondents with a graduate degree owned their home or were in the process of buying it?
Free
(Multiple Choice)
4.9/5 (26)
Correct Answer:Verified
D
A team of researchers is interested to know whether educational attainment affects the likelihood of owning or renting a home. They create a cross-tab with DWELOWN (Do you/Does your family) own your (home/apartment), pay rent, or what?") and DEGREE (respondents' highest educational degree), using a filter of "YEAR (2010-2014)." Figure 8.1 shows the resulting analysis.
-For respondents with less than a high school education, the modal category for the variable DWELOWN is:
(Multiple Choice)
4.8/5 (29)
A team of researchers is interested to know whether educational attainment affects the likelihood of owning or renting a home. They create a cross-tab with DWELOWN (Do you/Does your family) own your (home/apartment), pay rent, or what?") and DEGREE (respondents' highest educational degree), using a filter of "YEAR (2010-2014)." Figure 8.1 shows the resulting analysis.
-The variable DWELOWN is best described as:
(Multiple Choice)
4.9/5 (38)
A team of researchers is interested to know whether educational attainment affects the likelihood of owning or renting a home. They create a cross-tab with DWELOWN (Do you/Does your family) own your (home/apartment), pay rent, or what?") and DEGREE (respondents' highest educational degree), using a filter of "YEAR (2010-2014)." Figure 8.1 shows the resulting analysis.
-Which of the following statements best interprets the value of 16.4 in Figure 8.1?
(Multiple Choice)
4.9/5 (33)
A team of researchers is interested to know whether respondents' education is related to their personal income. They conduct a comparison of means with the variable REALINC (Respondent's personal annual income, measured in dollars) as the dependent variable and DEGREE as the "Row" variable, and use a filter of YEAR (2010-2014). The resulting analysis is shown in Figure 8.2
-The value of 16,164.88 in Figure 8.2 indicates that:
(Multiple Choice)
4.9/5 (39)
A team of researchers is interested to know whether educational attainment affects the likelihood of owning or renting a home. They create a cross-tab with DWELOWN (Do you/Does your family) own your (home/apartment), pay rent, or what?") and DEGREE (respondents' highest educational degree), using a filter of "YEAR (2010-2014)." Figure 8.1 shows the resulting analysis.
-The variable DEGREE is best described as:
(Multiple Choice)
4.9/5 (38)
A team of researchers is interested to know whether respondents' education is related to their personal income. They conduct a comparison of means with the variable REALINC (Respondent's personal annual income, measured in dollars) as the dependent variable and DEGREE as the "Row" variable, and use a filter of YEAR (2010-2014). The resulting analysis is shown in Figure 8.2
-In survey years 2012 - 2014, respondents who reported that their highest degree was a bachelor's degree, had an average score of approximately _______ on the variable REALINC.
(Multiple Choice)
4.7/5 (42)
A team of researchers is interested to know whether respondents' education is related to their personal income. They conduct a comparison of means with the variable REALINC (Respondent's personal annual income, measured in dollars) as the dependent variable and DEGREE as the "Row" variable, and use a filter of YEAR (2010-2014). The resulting analysis is shown in Figure 8.2
-Which of the following best describes the relationship between REALINC and DEGREE, based on Figure 8.2?
(Multiple Choice)
4.8/5 (34)
Filters
- Essay(0)
- Multiple Choice(0)
- Short Answer(0)
- True False(0)
- Matching(0)