Exam 5: Elasticity
Exam 1: Exploring Economics3 Questions
Exam 2: Production, Economic Growth, and Trade17 Questions
Exam 3: Supply and Demand26 Questions
Exam 4: Markets and Government24 Questions
Exam 5: Elasticity407 Questions
Exam 6: Consumer Choice and Demand394 Questions
Exam 7: Production and Costs322 Questions
Exam 8: Perfect Competition333 Questions
Exam 9: Monopoly309 Questions
Exam 10: Monopolistic Competition, Oligopoly, and Game Theory307 Questions
Exam 11: The Labor Market393 Questions
Exam 12: Land, Capital Markets, and Innovation267 Questions
Exam 13: Externalities and Public Goods342 Questions
Exam 14: Network Goods353 Questions
Exam 15: Poverty and Income Distribution303 Questions
Exam 16: International Trade17 Questions
Select questions type
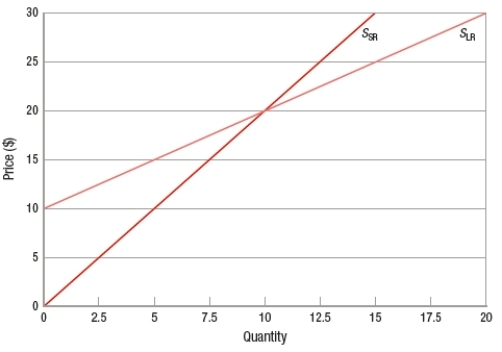
(Figure) The figure shows two supply curves for two different periods for the same product. Based on the information in the graph, which statement is TRUE?
(Multiple Choice)
4.8/5  (40)
(40)
If demand is inelastic, the tax incidence falls more heavily on the _____, and deadweight loss is relatively_____.
(Multiple Choice)
4.8/5 (40)
Which of these would result in a lower price elasticity of demand?
(Multiple Choice)
4.8/5 (36)
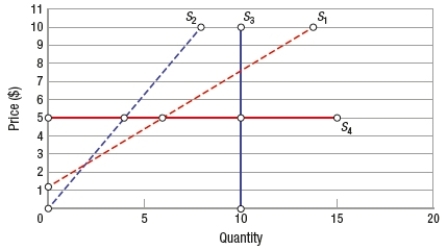
(Figure: Determining Elasticity of Supply) The graph has four supply curves. Which curve represents the supply curve in the market period?
(Multiple Choice)
4.8/5 (31)
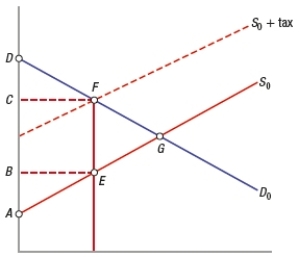
(Figure: Effects of Excise Tax) Based on the graph, after the excise tax is placed on the product, consumer surplus is
(Multiple Choice)
5.0/5 (43)
Which of these indicates a possible income elasticity measure for a normal good?
(Multiple Choice)
4.8/5 (28)
If the price of a product falls by 15% and the quantity supplied falls by 25%, we can assume that the elasticity of supply is inelastic.
(True/False)
4.8/5 (30)
If oranges cost $4 a bag last year, but they cost $5 a bag this year, the percent change in the price of oranges, using the base method, is
(Multiple Choice)
4.8/5 (35)
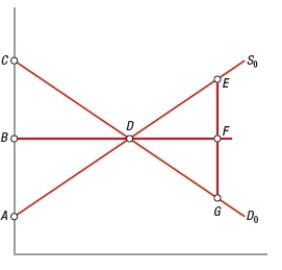
(Figure: Determining Consumer and Producer Surplus) Based on the graph, consumer surplus is shown by area
(Multiple Choice)
4.7/5 (33)
Which of these would result in a higher price elasticity of demand?
(Multiple Choice)
4.9/5 (29)
Products on which consumers spend a large share of their income are more likely to have elastic demand curves.
(True/False)
4.8/5 (29)
As the owner of a kayak tour business was looking over her financial records, she noticed that when the shop down the street increased the price of stand-up paddleboard tours by 10%, kayak tour sales increased by 15%. How might her sales be impacted if the paddleboard tour price is lowered by 20%?
(Multiple Choice)
4.9/5 (36)
Goods that are normally consumed together, such as coffee and tea, are called
(Multiple Choice)
4.8/5 (27)
If a product's price rises by 6% and its quantity demanded falls by 8%, then we can say that demand for this product is
(Multiple Choice)
4.9/5 (31)
In the short run, producers have the ability to change plant capacity.
(True/False)
5.0/5 (33)
Using the midpoint method, the price elasticity of demand between points a and b on the graph is
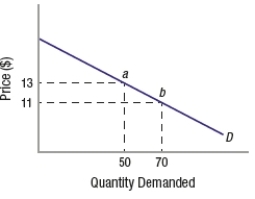
(Multiple Choice)
4.7/5 (23)
Demand for which of the following would be MOST inelastic?
(Multiple Choice)
4.8/5 (41)
Subira earns $125,000 a year and pays $20,000 in a certain tax. Qamar earns $75,000 a year and pays $15,000 in the same tax. We can conclude that this is a _____ tax.
(Multiple Choice)
4.8/5 (35)
Filters
- Essay(0)
- Multiple Choice(0)
- Short Answer(0)
- True False(0)
- Matching(0)