Exam 13: Controlling for a Third Variable: Multiple OlS Regression
Exam 1: The Importance of Statistics in the Criminological Sciences or Why Do I Have to Learn This Stuff24 Questions
Exam 2: Levels of Measurement and Aggregation25 Questions
Exam 3: Data Visualization Techniques: Ways of Understanding Data Distributions24 Questions
Exam 4: Measures of Central Tendency25 Questions
Exam 5: Measures of Dispersion23 Questions
Exam 6: Probability, Probability Distributions, and an Introduction to Inferential Statistics25 Questions
Exam 7: Point Estimation and Confidence Intervals24 Questions
Exam 8: From Estimation to Statistical Tests: Hypothesis Testing for One Population Mean and Proportion24 Questions
Exam 9: Testing Hypotheses With Categorical Data25 Questions
Exam 10: Hypothesis Tests Involving Two Population Means or Proportions24 Questions
Exam 11: Hypothesis Involving Three or More Population Means: Analysis of Variance25 Questions
Exam 12: Bivariate Correlation and Regression25 Questions
Exam 13: Controlling for a Third Variable: Multiple OlS Regression27 Questions
Exam 14: Regression Analysis With a Dichotomous Dependent Variable: Logit Models25 Questions
Select questions type
To obtain the t-statistic of a regression equation, one must ______.
Free
(Multiple Choice)
4.8/5  (25)
(25)
Correct Answer: Verified
B
You can determine which independent variable has the strongest effect on the dependent variable by comparing unstandardized partial slope coefficients.
Free
(True/False)
4.8/5 (38)
Correct Answer:Verified
False
Which of the following is NOT an assumption of the multivariate regression model?
Free
(Multiple Choice)
4.8/5 (32)
Correct Answer:Verified
D
When the independent variables are too highly correlated in a regression equation, they are considered to be?
(Multiple Choice)
4.8/5 (37)
The following diagram suggests that the relationship between X and Y is spurious due to Z
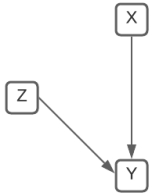
(True/False)
4.9/5 (32)
To use the multiple regression equation the dependent variables and all of the independent variables have to be measured at the interval or ratio level.
(True/False)
4.7/5 (34)
With a regression equation with two independent variables, an R2 of .42 indicates that ______.
(Multiple Choice)
4.9/5 (32)
For Model 1, the R2 equals .23 and for Model 2 the R2 = .35. This means that ______.
(Multiple Choice)
4.8/5 (31)
The null hypothesis of a regression equation with three independent variables can be stated as ______.
(Multiple Choice)
4.8/5 (27)
Which of the following is NOT one of the things that need to exist before we conclude that a causal connection exists between two variables?
(Multiple Choice)
4.7/5 (36)
Calculation of the standardized partial slopes is obtained by ______.
(Multiple Choice)
4.8/5 (34)
The following diagram suggests that the relationship between X and Y is properly temporally ordered where the independent variables comes before the dependent variable.
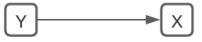
(True/False)
5.0/5 (30)
Given a multiple regression model with four independent variables, which of the following standardized partial slopes would have the strongest relationship with the dependent variable.
(Multiple Choice)
4.8/5 (43)
In a study, researchers find that ice cream consumption predicts increased crime. However, once they control for summertime (which also predicts crime), the relationship goes away. This is an example of ______.
(Multiple Choice)
4.7/5 (32)
A researcher is analyzing whether the rate of unlawful breaking is effected by the percent of poverty, percent male, percent nonwhite, and the percent of individuals between the ages of 15 and 24 residing in the census block. Given the following SPSS output, what would the researcher conclude? State the null and alternative hypotheses, discuss the F-statistic, the R2, R2 change, the beta coefficients, and which variable significantly affect the dependent variable.
Mod R Adjust Std. Error R Sig. F Squar ed R of the Square el S e Square Estimate Change F Change df1 df2 Change 1 .19 .038 .031 1843.30459 .038 5.294 2 267 .006 2 407 166 153 1723.12310 128 20.272 2 265 .000 a. Predictors: (Constant), percent nonwhite, percent poverty
b. Predictors: (Constant), percent nonwhite, percent poverty, percent 15 to 24, percent male Model Sum of Squares df Mean Square F Sig. 1 Regression 35977621.414 2 17988810.707 5.294 .00 Residual 907205072.766 267 3397771.808 Total 943182694.179 269 2 Regression 156357090.146 4 39089272.537 13.165 .00 Residual 786825604.033 265 2969153.223 Total 943182694.179 269 a. Dependent Variable: rateofubev
b. Predictors: (Constant), percent nonwhite, percent poverty
c. Predictors: (Constant), percent nonwhite, percent poverty, percent 15 to 24, percent male Unstandardized Standardized Coefficients Coefficients Model B Std. Error Beta 1 (Constant) 76.230 258.075 percentpoverty 27.276 8.606 .239 percentnonwhite -5.544 4.157 -.101 2 (Constant) -5080.529 1006.335 percentpoverty 21.254 8.173 .186 percentnonwhite 246 3.991 .004 percent15to24 -39.467 17.899 -.126 percentmale 116.906 19.763 .340 t Sig. .295 .768 3.169 .002 -1.334 .183 -5.049 .000 2.601 .010 .062 .951 -2.205 .028 5.916 .000 a. Dependent Variable: rateofubev
(Essay)
4.7/5 (31)
Filters
- Essay(0)
- Multiple Choice(0)
- Short Answer(0)
- True False(0)
- Matching(0)