Exam 4: Supply and Demand: An Initial Look
Exam 1: What Is Economics?227 Questions
Exam 2: The Economy: Myth and Reality150 Questions
Exam 3: The Fundamental Economic Problem: Scarcity and Choice250 Questions
Exam 4: Supply and Demand: An Initial Look308 Questions
Exam 5: An Introduction to Macroeconomics211 Questions
Exam 6: The Goals of Macroeconomic Policy207 Questions
Exam 7: Economic Growth: Theory and Policy223 Questions
Exam 8: Aggregate Demand and the Powerful Consumer214 Questions
Exam 9: Demand-Side Equilibrium: Unemployment or Inflation?211 Questions
Exam 10: Bringing in the Supply Side: Unemployment and Inflation?223 Questions
Exam 11: Managing Aggregate Demand: Fiscal Policy205 Questions
Exam 12: Money and the Banking System219 Questions
Exam 13: Monetary Policy: Conventional and Unconventional205 Questions
Exam 14: The Financial Crisis and the Great Recession61 Questions
Exam 15: The Debate over Monetary and Fiscal Policy214 Questions
Exam 16: Budget Deficits in the Short and Long Run210 Questions
Exam 17: The Trade Off between Inflation and Unemployment214 Questions
Exam 18: International Trade and Comparative Advantage226 Questions
Exam 19: The International Monetary System: Order or Disorder?213 Questions
Exam 20: Exchange Rates and the Macroeconomy214 Questions
Select questions type
A severe freeze has once again damaged the Florida orange crop.The impact on the market for oranges will be a leftward shift in
(Multiple Choice)
4.9/5  (43)
(43)
The quantity of goods exchanged in a market will be below the equilibrium quantity
(Multiple Choice)
4.9/5 (41)
Assume the demand schedule for cookies is downward sloping.If the price of cookies falls from $1.50 to $1.25 per dozen,
(Multiple Choice)
4.9/5 (45)
Studies at Cornell University revealed that chickens grow 2 percent larger when a red mitten is placed in their cage and Vivaldi is played in the coop.Resultant feed savings are estimated at $60 million a year.In the chicken market,the
(Multiple Choice)
4.9/5 (37)
For more than a thousand years,the Catholic Church required its members to abstain from meat on Fridays.Catholics customarily ate fish on Friday.After 1966 abstinence from meat on Fridays was no longer required.Consequently,the
(Multiple Choice)
4.8/5 (38)
Figure 4-12
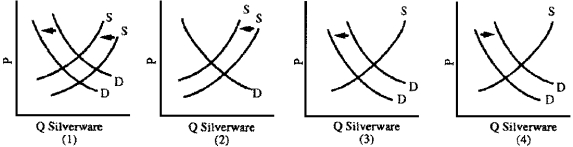 -The silverware industry has been in serious decline since the 1980s.Family dining habits are less formal so people purchase less silverware.Also,in 2006-2008,the price of silver increased from $5 to $20 per ounce.Which graph in Figure 4-12 best illustrates these developments?
(Multiple Choice)
4.9/5 (30)
Drawing the supply curve and the demand curve on the same graph helps show how price is determined.
(True/False)
4.7/5 (43)
Cost-reducing technological advancements allow suppliers to earn more profits but have no noticeable effect on the supply curve.
(True/False)
4.8/5 (25)
Figure 4-22
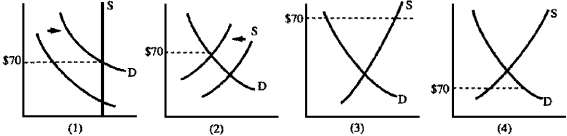 -Because of falling oil prices in the past,Libya could afford fewer imported goods.Government controls were established to limit imports of cigarettes.In 1985,the market price of Marlboros rose to $70 a carton.Which graph in Figure 4-22 best depicts this situation?
(Multiple Choice)
4.8/5 (39)
We observed that the price of a good rises and the quantity purchased also rises.Everything else being equal,it is consistent that
(Multiple Choice)
4.8/5 (40)
A decrease in the price of VCRs will increase demand for video cassettes.
(True/False)
4.7/5 (41)
A decrease in price of a certain good most likely will lead to
(Multiple Choice)
4.9/5 (42)
Explain the effect of the following changes on equilibrium price and quantity of a commodity:
(a)increase in average incomes.
(b)increase in population.
(Essay)
4.9/5 (42)
Which of the following would cause an increase in demand for Toyota automobiles?
(Multiple Choice)
4.9/5 (36)
From 2007 to 2008,the Federal Reserve System reduced interest rates,the price which borrowers pay.As a result,economists expected that the quantity of money supplied would
(Multiple Choice)
5.0/5 (38)
Filters
- Essay(0)
- Multiple Choice(0)
- Short Answer(0)
- True False(0)
- Matching(0)