Exam 10: Bringing in the Supply Side: Unemployment and Inflation?
Exam 1: What Is Economics?227 Questions
Exam 2: The Economy: Myth and Reality150 Questions
Exam 3: The Fundamental Economic Problem: Scarcity and Choice250 Questions
Exam 4: Supply and Demand: An Initial Look308 Questions
Exam 5: An Introduction to Macroeconomics211 Questions
Exam 6: The Goals of Macroeconomic Policy207 Questions
Exam 7: Economic Growth: Theory and Policy223 Questions
Exam 8: Aggregate Demand and the Powerful Consumer214 Questions
Exam 9: Demand-Side Equilibrium: Unemployment or Inflation?211 Questions
Exam 10: Bringing in the Supply Side: Unemployment and Inflation?223 Questions
Exam 11: Managing Aggregate Demand: Fiscal Policy205 Questions
Exam 12: Money and the Banking System219 Questions
Exam 13: Monetary Policy: Conventional and Unconventional205 Questions
Exam 14: The Financial Crisis and the Great Recession61 Questions
Exam 15: The Debate over Monetary and Fiscal Policy214 Questions
Exam 16: Budget Deficits in the Short and Long Run210 Questions
Exam 17: The Trade Off between Inflation and Unemployment214 Questions
Exam 18: International Trade and Comparative Advantage226 Questions
Exam 19: The International Monetary System: Order or Disorder?213 Questions
Exam 20: Exchange Rates and the Macroeconomy214 Questions
Select questions type
The aggregate supply curve is a fixed point representing potential GDP.
(True/False)
4.7/5  (33)
(33)
Figure 10-2
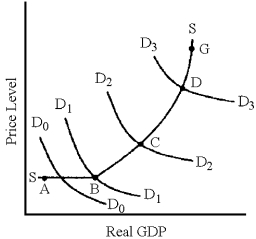 -In Figure 10-2,which segment of the aggregate supply curve has the smallest multiplier effect?
(Multiple Choice)
4.8/5 (38)
A recession can be expected to reduce inflation in the economy if the recession is caused by a(n)
(Multiple Choice)
4.9/5 (34)
If profit per unit equals (price - cost per unit)and costs are temporarily fixed,then the aggregate supply curve will have
(Multiple Choice)
4.8/5 (37)
The reason that stagflation tends to follow an inflationary gap is that
(Multiple Choice)
4.8/5 (38)
Figure 10-6
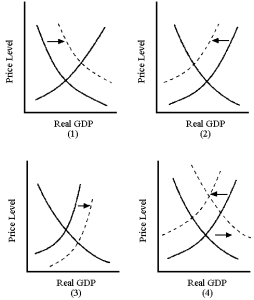 -In Figure 10-6,which graph best illustrates an autonomous increase in consumption spending?
(Multiple Choice)
4.9/5 (34)
Aggregate supply grows over time because of growing consumer and government spending.
(True/False)
4.8/5 (45)
Recessionary gaps are associated with output below potential and high unemployment rates.
(True/False)
4.9/5 (38)
When OPEC cut energy production in 1973,the aggregate supply curve shifted outward.
(True/False)
4.8/5 (49)
The aggregate supply curve is the relationship between the price level and the quantity of real GDP purchased.
(True/False)
4.8/5 (36)
If the price level does not fall or only falls very slowly,then the result will be a prolonged period of
(Multiple Choice)
4.9/5 (32)
The relationship between the price level and the quantity of real GDP supplied is
(Multiple Choice)
4.8/5 (33)
Figure 10-6
-In Figure 10-6,which graph best illustrates an adverse supply shock accompanied by an increase in government spending?
(Multiple Choice)
4.7/5 (34)
Economists believed that the U.S.economy had a (n)____ in 2006 and 2007.
(Multiple Choice)
4.8/5 (32)
If the data show that periods of high economic growth rate accompanied by high inflation rates,then changes in aggregate demand are the primary source of economic fluctuations.
(True/False)
4.9/5 (40)
Filters
- Essay(0)
- Multiple Choice(0)
- Short Answer(0)
- True False(0)
- Matching(0)