Exam 10: Bringing in the Supply Side: Unemployment and Inflation?
Exam 1: What Is Economics?227 Questions
Exam 2: The Economy: Myth and Reality150 Questions
Exam 3: The Fundamental Economic Problem: Scarcity and Choice250 Questions
Exam 4: Supply and Demand: An Initial Look308 Questions
Exam 5: An Introduction to Macroeconomics211 Questions
Exam 6: The Goals of Macroeconomic Policy207 Questions
Exam 7: Economic Growth: Theory and Policy223 Questions
Exam 8: Aggregate Demand and the Powerful Consumer214 Questions
Exam 9: Demand-Side Equilibrium: Unemployment or Inflation?211 Questions
Exam 10: Bringing in the Supply Side: Unemployment and Inflation?223 Questions
Exam 11: Managing Aggregate Demand: Fiscal Policy205 Questions
Exam 12: Money and the Banking System219 Questions
Exam 13: Monetary Policy: Conventional and Unconventional205 Questions
Exam 14: The Financial Crisis and the Great Recession61 Questions
Exam 15: The Debate over Monetary and Fiscal Policy214 Questions
Exam 16: Budget Deficits in the Short and Long Run210 Questions
Exam 17: The Trade Off between Inflation and Unemployment214 Questions
Exam 18: International Trade and Comparative Advantage226 Questions
Exam 19: The International Monetary System: Order or Disorder?213 Questions
Exam 20: Exchange Rates and the Macroeconomy214 Questions
Select questions type
Figure 10-7
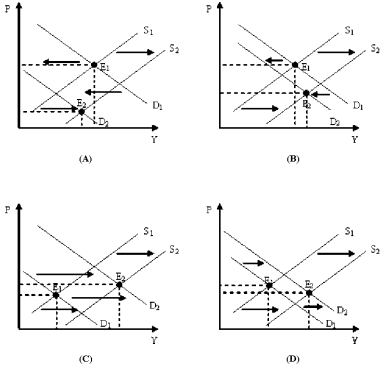 -Refer to Figure 10-7.Which of the diagrams in Figure 10-7 represents a period of economic growth and inflation?
(Multiple Choice)
4.9/5  (31)
(31)
In 1973,the U.S.experienced a decline in output and high inflation.
(True/False)
4.8/5 (33)
If the price level rises,what will happen to the level of real GDP supplied?
(Multiple Choice)
4.8/5 (32)
Figure 10-1
 -What does inflation do to the value of the oversimplified multiplier?
(Multiple Choice)
4.9/5 (40)
To calculate a firm's per unit of output profit,it is necessary to subtract
(Multiple Choice)
4.9/5 (40)
College graduates looking for jobs were less fortunate in 2007 than graduates in 2009.
(True/False)
4.8/5 (39)
Part of the normal aftermath of a period of excessive aggregate demand is
(Multiple Choice)
4.7/5 (37)
Using the aggregate demand/aggregate supply model,explain the difference in the employment prospects of the graduates of 2007 and 2009.
(Essay)
4.9/5 (31)
As the U.S.labor force grows and the nation's capital stock is augmented by investment,the
(Multiple Choice)
4.8/5 (31)
What causes the aggregate supply curve to have an upward slope in the short run,but a vertical slope in the long run?
(Essay)
4.8/5 (39)
How is it possible for the economy to have an inflationary gap?
(Multiple Choice)
5.0/5 (38)
The slope of the aggregate supply curve decreases as total output increases.
(True/False)
4.8/5 (42)
Figure 10-7
-Which of the panels in Figure 10-7 shows an economic recession caused by primarily by a change aggregate demand?
(Multiple Choice)
4.8/5 (29)
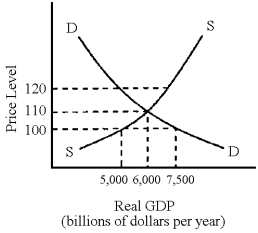
Figure 10-8
 -Figure 10-8 describes which of the following periods in the U.S.?
(Multiple Choice)
4.8/5 (38)
A price level lower than equilibrium will cause quantity supplied to exceed quantity demanded.
(True/False)
4.8/5 (30)
Like the supply curve for individual goods and services,the aggregate supply curve slopes upward and to the right.
(True/False)
4.8/5 (34)
From 2005 to 2006 the U.S.economy experienced significant inflation because the aggregate demand curve shifted outward more than the aggregate supply curve shifted outward.
(True/False)
4.9/5 (33)
Filters
- Essay(0)
- Multiple Choice(0)
- Short Answer(0)
- True False(0)
- Matching(0)