Exam 20: Exchange Rates and the Macroeconomy
Exam 1: What Is Economics?227 Questions
Exam 2: The Economy: Myth and Reality150 Questions
Exam 3: The Fundamental Economic Problem: Scarcity and Choice250 Questions
Exam 4: Supply and Demand: An Initial Look308 Questions
Exam 5: An Introduction to Macroeconomics211 Questions
Exam 6: The Goals of Macroeconomic Policy207 Questions
Exam 7: Economic Growth: Theory and Policy223 Questions
Exam 8: Aggregate Demand and the Powerful Consumer214 Questions
Exam 9: Demand-Side Equilibrium: Unemployment or Inflation?211 Questions
Exam 10: Bringing in the Supply Side: Unemployment and Inflation?223 Questions
Exam 11: Managing Aggregate Demand: Fiscal Policy205 Questions
Exam 12: Money and the Banking System219 Questions
Exam 13: Monetary Policy: Conventional and Unconventional205 Questions
Exam 14: The Financial Crisis and the Great Recession61 Questions
Exam 15: The Debate over Monetary and Fiscal Policy214 Questions
Exam 16: Budget Deficits in the Short and Long Run210 Questions
Exam 17: The Trade Off between Inflation and Unemployment214 Questions
Exam 18: International Trade and Comparative Advantage226 Questions
Exam 19: The International Monetary System: Order or Disorder?213 Questions
Exam 20: Exchange Rates and the Macroeconomy214 Questions
Select questions type
For a major country with extensive capital flows,what is the effect of a decrease in interest rates?
(Multiple Choice)
4.8/5  (24)
(24)
Figure 20-1
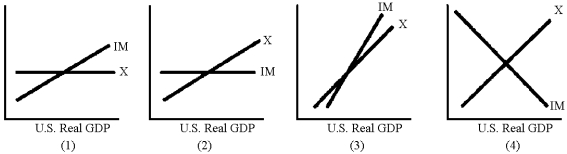 -Which of the graphs in Figure 20-1 best illustrates the behavior of exports and imports in relation to U.S.real GDP?
(Multiple Choice)
4.9/5 (34)
A rise in the domestic interest rate leads to capital outflows and makes the currency depreciate.
(True/False)
4.8/5 (30)
The principal danger to Japan in 2001 when the yen was appreciating was that this would
(Multiple Choice)
4.8/5 (32)
The monetary expansion of the mid-1990s was expected to lead to a currency appreciation.
(True/False)
4.8/5 (37)
In an open economy,the government deficit is 600 and saving exceeds investment by 500,so in equilibrium the trade deficit (IM − X)must be
(Multiple Choice)
4.8/5 (28)
If European economies experience a period of sustained recession and the United States does not,what will happen in the United States?
(Multiple Choice)
4.8/5 (32)
In the 1990s the United States eliminated its budget deficit and expanded the money supply.This should have led to
(Multiple Choice)
4.9/5 (31)
In an open economy,aggregate supply consists of domestic production plus imports.
(True/False)
4.8/5 (34)
Figure 20-7
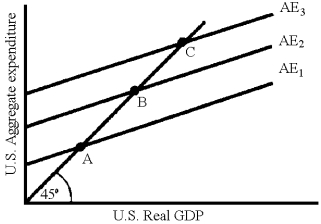 -In Figure 20-7,there are three aggregate expenditure functions (C + I + G + X − IM)for an open economy.Which of the following would cause a movement from B to A?
(Multiple Choice)
4.8/5 (40)
Figure 20-8
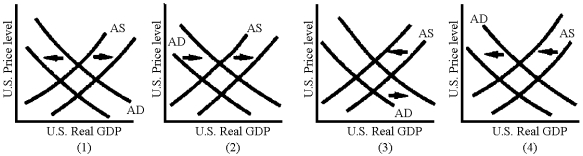 -Which of the graphs in Figure 20-8 represents the effects of a currency appreciation?
(Multiple Choice)
4.8/5 (37)
Suppose the dollar depreciates from 89 Japanese yen to 79 Japanese yen.One would expect
(Multiple Choice)
4.9/5 (41)
Explain how exchange rates affect the level of aggregate economic activity and the price level.Use appropriate AS/AD diagrams to illustrate your answer.
(Essay)
4.8/5 (28)
Filters
- Essay(0)
- Multiple Choice(0)
- Short Answer(0)
- True False(0)
- Matching(0)