Exam 7: Inferences About the Difference Between Two Means
Exam 1: Introduction30 Questions
Exam 2: Data Representation30 Questions
Exam 3: Univariate Population Parameters and Sample Statistics30 Questions
Exam 4: Normal Distribution and Standard Scores30 Questions
Exam 5: Introduction to Probability and Sample Statistics30 Questions
Exam 6: Inferences About a Single Mean30 Questions
Exam 7: Inferences About the Difference Between Two Means30 Questions
Exam 8: Inferences About Proportions30 Questions
Exam 9: Inferences About Variances30 Questions
Exam 10: Bivariate Measures of Association30 Questions
Exam 11: One-Factor Anova: Fixed-Effects Model30 Questions
Exam 12: Multiple Comparison Procedures30 Questions
Exam 13: Factorial Anova: Fixed-Effects Model30 Questions
Exam 14: One-Factor Fixed-Effects Ancova With Single Covariate30 Questions
Exam 15: Random- and Mixed-Effects Analysis of Variance Models30 Questions
Exam 16: Hierarchical and Randomized Block Analysis of Variance Models30 Questions
Exam 17: Simple Linear Regression35 Questions
Exam 18: Multiple Regression29 Questions
Exam 19: Logistic Regression30 Questions
Select questions type
A professor is examining success of tenure-track faculty in attaining tenure at their postsecondary institution. He surveys tenure-track faculty who have went through the tenure process in the past year and gathers data on two variables: 1) the number of publications in refereed journals (measured in whole numbers); and 2) whether or not they attained tenure (yes or no). The research question is: Is there an average difference in the number of publications based on faculty who attain tenure as compared to faculty who do not attain tenure? Which of the following represents the INDEPENDENT variable?
Free
(Multiple Choice)
4.8/5  (36)
(36)
Correct Answer: Verified
A
A researcher conducts an independent t test. She computes eta squared and finds the value to be .16. What interpretation can be made from this?
Free
(Multiple Choice)
4.9/5 (30)
Correct Answer:Verified
E
In which one of the following is evidence of normality suggested?
Free
(Multiple Choice)
4.8/5 (36)
Correct Answer:Verified
C
A professor is examining success of tenure-track faculty in attaining tenure at their postsecondary institution. He surveys tenure-track faculty who have went through the tenure process in the past year and gathers data on two variables: 1) the number of publications in refereed journals (measured in whole numbers); and 2) whether or not they attained tenure (yes or no). The research question is: Is there an average difference in the number of publications based on faculty who attain tenure as compared to faculty who do not attain tenure? Which one of the following represents how the ALTERNATIVE hypothesis will be written?
(Multiple Choice)
5.0/5 (31)
Malani is examining the following research question: Is there a mean difference in the weight of garbage thrown away per week by homeowners as compared to renters? Use the 'Garbage' dataset. "Weight" is a ratio level measurement scale variable. "Own_Rent" is a nominal level measurement scale variable. Conduct the the appropriate inferential statistical procedure at an alpha level of .05. Do NOT exclude any cases when conducting the test. Which one of the following is correct based on reviewing the assumptions?
(Multiple Choice)
4.7/5 (35)
In examining the distribution of a ratio level measurement scale variable, Wesley finds that the skewness of the distribution is -2.96 and the kurtosis is +1.72. He also finds that the p value for the Shapiro Wilks test for the variable is .03. Which of the following is suggested?
(Multiple Choice)
4.8/5 (35)
Review the following SPSS output. Interpret the output including identifying the specific statistical procedure that has been used and reporting the extent to which the test is statistically significant. Include appropriate evidence (e.g., values from the output).
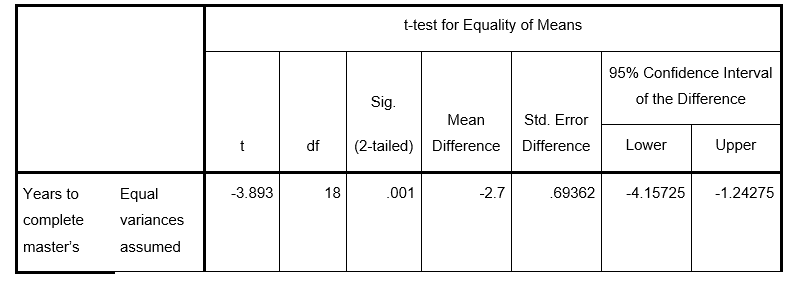
(Essay)
4.8/5 (40)
A professor is examining success of tenure-track faculty in attaining tenure at their postsecondary institution. He surveys tenure-track faculty who have went through the tenure process in the past year and gathers data on two variables: 1) the number of publications in refereed journals (measured in whole numbers); and 2) whether or not they attained tenure (yes or no). The research question is: Is there an average difference in the number of publications based on faculty who attain tenure as compared to faculty who do not attain tenure? Which one of the following represents how the NULL hypothesis will be written?
(Multiple Choice)
4.8/5 (33)
Malani is examining the following research question: Is there a mean difference in the weight of garbage thrown away per week by homeowners as compared to renters? Use the 'Garbage' dataset. "Weight" is a ratio level measurement scale variable. "Own_Rent" is a nominal level measurement scale variable. Conduct the the appropriate inferential statistical procedure at an alpha level of .05. Do NOT exclude any cases when conducting the test. Which one of the following is correct based on reviewing the assumptions?
(Multiple Choice)
4.8/5 (50)
A researcher collects data on shyness for two groups: 1) high school students who have their own cell phone; and 2) high school students who do NOT have a cell phone. Shyness is measured by the Shyness Inventory (an interval scaled variable). For group one (students who have their own cell phone), the following values are measured from the Shyness Inventory: 89, 95, 72, 68, 91, 86. For group two (students who do NOT have their own cell phone), the following values are measured from the Shyness Inventory: 56, 78, 61, 43, 80, 50. Conduct the appropriate statistical procedure at alpha of .05 to determine if there is a difference, on average, of the shyness of students who have versus do not have a cell phone. Is the assumption of homogeneity of variances met?
(True/False)
4.9/5 (32)
A researcher collects information on students enrolled in a statistics course to determine if their level of anxiety changes from the time they begin the course to the time they end the course. Lower scores on the instrument reflect decreased anxiety toward statistics. The pretest scores for the students were: 88, 94, 91, 84, 80, 76, 96, 90, 83, 95. The posttest scores were: 56, 64, 72, 80, 42, 40, 51, 32, 61, 59. (The data are in respective order. For example, for student A the pretest score was 88 and posttest score was 56; for student B the pretest score was 94 and posttest score was 64, and so forth.) Conduct the appropriate statistical procedure at alpha of .05 to determine if there is a difference in statistics anxiety, on average, prior to and after completion of a statistics course. Is there a statistically significant difference between the pretest and posttest means?
(Multiple Choice)
4.8/5 (37)
A researcher collects information on students enrolled in a statistics course to determine if their level of anxiety changes from the time they begin the course to the time they end the course. Lower scores on the instrument reflect decreased anxiety toward statistics. The pretest and posttest scores for the students were: 88, 94, 91, 84, 80, 76, 96, 90, 83, 95. The posttest scores were: 56, 64, 72, 80, 42, 40, 51, 32, 61, 59. (The data are in respective order. For example, for student A the pretest score was 88 and posttest score was 56; for student B the pretest score was 94 and posttest score was 64, and so forth.) Conduct the appropriate statistical procedure at alpha of .05 to determine if there is a difference in statistics anxiety, on average, prior to and after completion of a statistics course. What is the confidence interval of the mean difference?
(Multiple Choice)
4.8/5 (30)
A research report indicates that the mean birth weight of twins that participated in their study was 5.5 pounds (variance = .25; n =15) and the mean birth weight of singleton babies was 7.7 pounds (variance = .40; n = 15). Calculate and interpret Cohen's d effect size.
(Essay)
4.8/5 (38)
In conducting an independent t test, a researcher finds a p value of .356 for Levene's test of homogeneity of variance. Has the homogeneity assumption been violated?
(True/False)
4.8/5 (35)
Review the following SPSS output. Interpret the output including identifying the specific statistical procedure that has been used and reporting the extent to which the test is statistically significant. Include appropriate evidence (e.g., test statistic value, degrees of freedom, and p value).
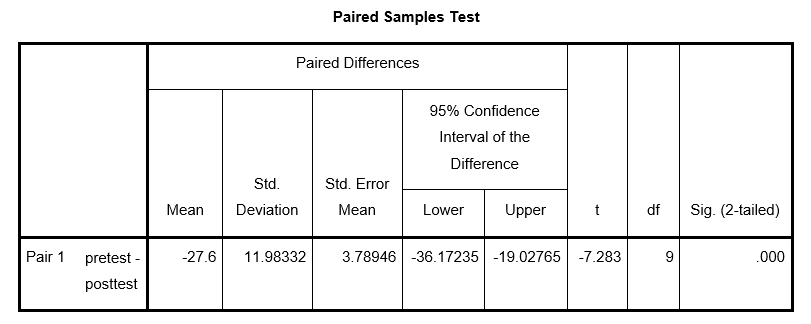
(Essay)
4.7/5 (38)
You read the following in a published research study: 1) test statistic value of 2.56; 2) alpha level of .10; 3) phi coefficient of .75; 4) Shapiro-Wilk's p value of .05. Which of the following statements is correct?
(Multiple Choice)
4.7/5 (34)
You read the following in a published research study: 1) Shapiro Wilk's p value of .05; 2) alpha level of .001; 3) eta squared of .25; 4) Levene's test p value of .005. Which of the following statements is correct?
(Multiple Choice)
4.9/5 (26)
A swim coach designs an experiment to determine if children who participate in group versus individual swim lessons have different swimming skills, on average. She randomly selects 20 children who have registered for swim lessons and randomly assigns them to group or individual swim lessons and collects data on the following: 1) type of swim lesson participated (two categories: group or individual); and 2) swimming skills (measured on a a scale from 0 to 200). Her research question reads: Is there a mean difference in swimming skills for children who participate in individual versus group swimming lessons? Which of the following represents the INDEPENDENT variable?
(Multiple Choice)
4.8/5 (37)
A researcher draws a random sample of 500 participants for a study with the intent to perform a dependent t test for a directional hypothesis. He reviews the normality indices and finds slight non-normality. What is the most appropriate recommendation for the researcher?
(Multiple Choice)
4.8/5 (41)
Filters
- Essay(0)
- Multiple Choice(0)
- Short Answer(0)
- True False(0)
- Matching(0)