Exam 10: Aggregate Supply.
Exam 1: The Art and Science of Economic Analysis.203 Questions
Exam 2: Economic Tools and Economic Systems.209 Questions
Exam 3: Economic Decision Makers.225 Questions
Exam 4: Demand, Supply, and Markets.205 Questions
Exam 5: Introduction to Macroeconomics.201 Questions
Exam 6: Tracking the U. S. Economy.211 Questions
Exam 7: Unemployment and Inflation.199 Questions
Exam 8: Productivity and Growth.200 Questions
Exam 9: Aggregate Demand.200 Questions
Exam 10: Aggregate Supply.202 Questions
Exam 11: Fiscal Policy.202 Questions
Exam 12: Federal Budgets and Public Policy.203 Questions
Exam 13: Money and the Financial System.201 Questions
Exam 14: Banking and the Money Supply.200 Questions
Exam 15: Monetary Theory and Policy.200 Questions
Exam 16: Macro Policy Debate: Active or Passive?198 Questions
Exam 17: International Trade.200 Questions
Exam 18: International Finance.195 Questions
Exam 19: Economic Development.200 Questions
Select questions type
How much is the output gap if short-run output is $18.2 trillion and potential output is $18.0 trillion?
(Multiple Choice)
4.9/5  (36)
(36)
Exhibit 10.1
 -Refer to Exhibit 10.1, which shows the short-run aggregate supply (SRAS) curve of an economy. At a price of P₁, firms will _____
(Multiple Choice)
4.8/5 (40)
During a particular year, nominal wages increased by 4 percent but real wages declined by 2 percent. This implies that the price level increased by 6 percent.
(True/False)
4.8/5 (39)
Exhibit 10.1
-Refer to Exhibit 10.1, which shows the short-run aggregate supply (SRAS) curve of an economy. To the left of Y₁, _____
(Multiple Choice)
4.7/5 (30)
Exhibit 10.7
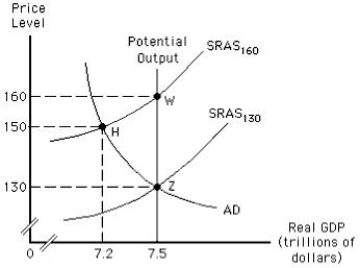 -Refer to Exhibit 10.7, which shows the equilibrium price level and real GDP in an aggregate demand-aggregate supply model. If output was $7.5 trillion at point W and decreases to 7.2 trillion, the economy moves from _____
(Multiple Choice)
4.9/5 (37)
Exhibit 10.1
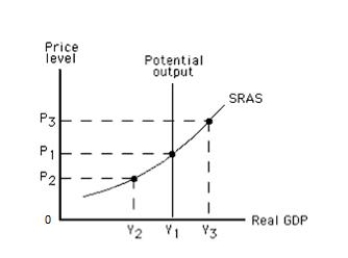 -Refer to Exhibit 10.1, which shows the short-run aggregate supply curve of an economy. If P₃ is the price level prevailing in the economy, _____
(Multiple Choice)
4.9/5 (37)
Exhibit 10.9
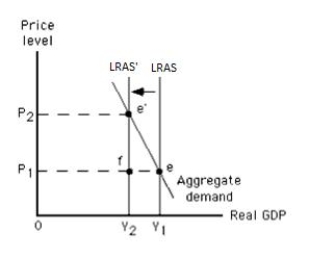 -Refer to Exhibit 10.9, which shows the long-run equilibrium in the aggregate demand-aggregate supply model. Which of the following changes is depicted by the movement from Y₁ to Y₂?
(Multiple Choice)
4.7/5 (35)
An increase in the federal minimum wage will shift the long-run aggregate supply curve to the left.
(True/False)
4.7/5 (37)
Exhibit 10.1
-Refer to Exhibit 10.1, which shows the short-run aggregate supply (SRAS) curve of an economy. At Y₃, _____
(Multiple Choice)
4.9/5 (46)
If the price level in an economy turns out to be higher than that expected by workers and firms, _____.
(Multiple Choice)
4.9/5 (38)
Which of the following occurs when an expansionary gap is closed in the long run by the action of firms?
(Multiple Choice)
4.8/5 (43)
Which of the following is true in the short run but not in the long run?
(Multiple Choice)
4.7/5 (39)
Exhibit 10.5
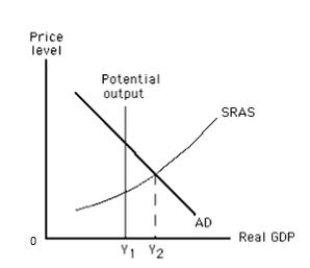 -Refer to Exhibit 10.5, which shows the short-run equilibrium in an aggregate demand-aggregate supply model. The distance between Y₁ and Y₂ represents _____
(Multiple Choice)
4.8/5 (37)
Given the aggregate demand curve, an increase in the supply of a productive resource will _____
(Multiple Choice)
4.9/5 (31)
Unexpected events that reduce aggregate supply, sometimes only temporarily, are _____ shocks.
(Multiple Choice)
4.8/5 (39)
Suppose an economy is initially in long-run equilibrium, and it then experiences a supply shock in the form of exceptionally high energy prices. Which of these will be true in this economy?
(Multiple Choice)
4.9/5 (44)
Suppose Jack's salary increased from $100,000 to $200,000 per year between 2004 and 2014 and the price index increased from 100 to 300 during the same period. Which of the following statements best describes Jack's situation?
(Multiple Choice)
4.7/5 (36)
Filters
- Essay(0)
- Multiple Choice(0)
- Short Answer(0)
- True False(0)
- Matching(0)