Exam 10: Aggregate Supply.
Exam 1: The Art and Science of Economic Analysis.203 Questions
Exam 2: Economic Tools and Economic Systems.209 Questions
Exam 3: Economic Decision Makers.225 Questions
Exam 4: Demand, Supply, and Markets.205 Questions
Exam 5: Introduction to Macroeconomics.201 Questions
Exam 6: Tracking the U. S. Economy.211 Questions
Exam 7: Unemployment and Inflation.199 Questions
Exam 8: Productivity and Growth.200 Questions
Exam 9: Aggregate Demand.200 Questions
Exam 10: Aggregate Supply.202 Questions
Exam 11: Fiscal Policy.202 Questions
Exam 12: Federal Budgets and Public Policy.203 Questions
Exam 13: Money and the Financial System.201 Questions
Exam 14: Banking and the Money Supply.200 Questions
Exam 15: Monetary Theory and Policy.200 Questions
Exam 16: Macro Policy Debate: Active or Passive?198 Questions
Exam 17: International Trade.200 Questions
Exam 18: International Finance.195 Questions
Exam 19: Economic Development.200 Questions
Select questions type
Cyclical unemployment in an economy will be zero when _____
(Multiple Choice)
4.8/5  (37)
(37)
Which of the following explains the shape of the short-run aggregate supply curve?
(Multiple Choice)
4.8/5 (40)
Which of the following is true when an economy is in long-run equilibrium?
(Multiple Choice)
4.9/5 (27)
Exhibit 10.1
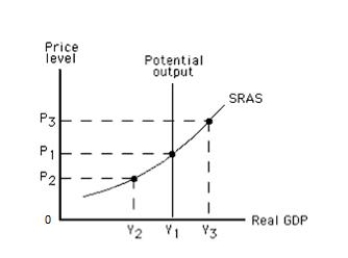 -Refer to Exhibit 10.1, which shows the short-run aggregate supply curve of an economy. An expansionary gap would be represented by the distance between _____
(Multiple Choice)
4.7/5 (40)
If resource suppliers and demanders find out that the actual price level exceeds the expected price level, they will take corrective actions that will _____
(Multiple Choice)
4.9/5 (40)
Exhibit 10.3
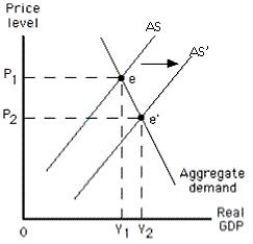 -Refer to Exhibit 10.3, which shows an aggregate demand-aggregate supply model. The shift from AS to AS' represents a(n) _____
(Multiple Choice)
4.8/5 (39)
Exhibit 10.1
 -Refer to Exhibit 10.1, which shows the short-run aggregate supply (SRAS) curve of an economy. If output is at Y₁, _____
(Multiple Choice)
4.7/5 (42)
Suppose the real wage remains unchanged between Year 1 and Year 2 but the nominal wage increases from $20 to $24. Based on this information, we can conclude that the price level has _____
(Multiple Choice)
4.9/5 (47)
In the long run, the price level in an economy is determined solely by _____
(Multiple Choice)
4.9/5 (46)
Exhibit 10.2
 -Refer to Exhibit 10.2, which shows the short-run aggregate supply curve of an economy. In this Exhibit, the distance between Y₁ and Y₂ represents _____
(Multiple Choice)
4.7/5 (36)
Table 10.2
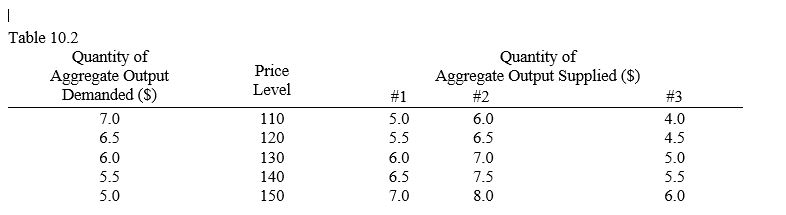 -Refer to Table 10.2, which shows the aggregate demand and aggregate supply in an economy. In schedule #2, the equilibrium output and price level for the economy are _____
(Multiple Choice)
4.9/5 (43)
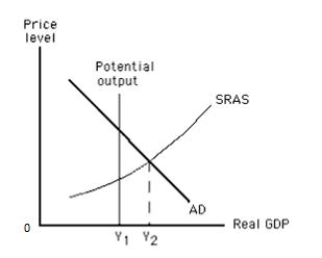
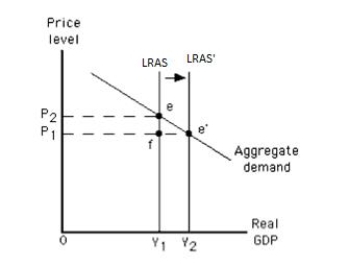
Exhibit 10.9
 -Refer to Exhibit 10.9, which shows the long-run equilibrium in the aggregate demand-aggregate supply model. The movement from Y₁ to Y₂ in this exhibit could have been caused by a(n) _____
(Multiple Choice)
4.8/5 (31)
Which of the following is most likely to increase long-run aggregate supply in an economy?
(Multiple Choice)
4.9/5 (36)
Table 10.1
-Refer to Table 10.1, which shows the aggregate demand and aggregate supply in an economy. The equilibrium output and price level for the economy are _____
(Multiple Choice)
4.8/5 (37)
How much is the output gap if short-run output is $18.0 trillion and potential output is $18.2 trillion?
(Multiple Choice)
4.9/5 (38)
An expansionary gap is closed in the long run by a(n) _____
(Multiple Choice)
4.8/5 (41)
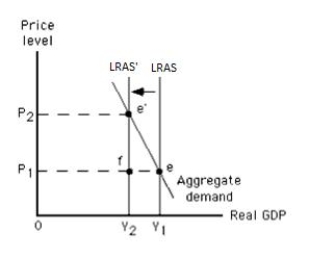
Exhibit 10.8
 -Refer to Exhibit 10.8, which shows the long-run equilibrium in an aggregate demand-aggregate supply model. Which of the following is indicated by the arrow given?
(Multiple Choice)
4.8/5 (39)
In the short run, there is a positive relationship between _____
(Multiple Choice)
4.9/5 (34)
Filters
- Essay(0)
- Multiple Choice(0)
- Short Answer(0)
- True False(0)
- Matching(0)