Exam 14: Graphical Representation of Data
Exam 1: Psychology, Science and Research10 Questions
Exam 2: Measuring People Variables, Samples and the Qualitative Critique10 Questions
Exam 3: Experiments and Experimental Designs in Psychology10 Questions
Exam 4: Validity in Psychological Research10 Questions
Exam 5: Quasi-Experiments and Non-Experiments10 Questions
Exam 6: Observational Methods Watching and Being With People10 Questions
Exam 7: Interview Methods Asking People Direct Questions10 Questions
Exam 8: Psychological Tests and Measurement Scales10 Questions
Exam 9: Comparison Studies Cross-Sectional, Longitudinal and Cross-Cultural Studies10 Questions
Exam 10: Qualitative Approaches in Psychology10 Questions
Exam 11: Ethical Issues in Psychological Research10 Questions
Exam 12: Analysing Qualitative Data10 Questions
Exam 13: Statistics Organising the Data10 Questions
Exam 14: Graphical Representation of Data10 Questions
Exam 15: Frequencies and Distributions10 Questions
Exam 16: Significance Testing Was It a Real Effect10 Questions
Exam 17: Testing for Differences Between Two Samples10 Questions
Exam 18: Tests for Categorical Variables and Frequency Tables10 Questions
Exam 19: Correlation7 Questions
Exam 20: Regression and Multiple Regression2 Questions
Exam 22: Multi-Level Analysis Differences Between More Than Two Conditions Anova10 Questions
Exam 23: Multi-Factorial Anova Designs10 Questions
Exam 24: Anova for Repeated Measures Designs10 Questions
Exam 25: Choosing a Significance Test for Your Data10 Questions
Exam 26: Planning Your Practical and Writing up Your Report10 Questions
Select questions type
2) The following stem and leaf chart shows that in the data set: Stem Leaf 0 5 1 2 129 3 344555569 4 00122235667778 5 0112223333444556677889 6 000112456677777899 7 1344578 8 01
(Multiple Choice)
4.8/5  (39)
(39)
3) A problem with the chart shown below is that: Figure 1 Mean reading times (secs.) for trained and untrained groups
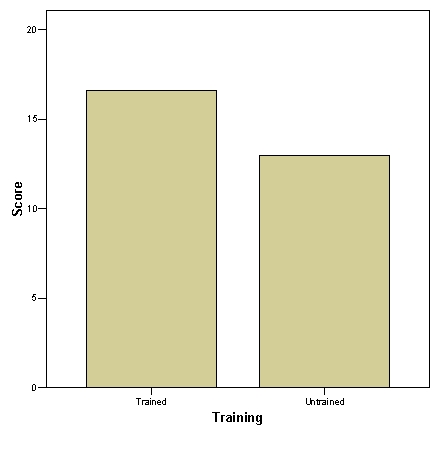
(Multiple Choice)
4.9/5 (37)
5) A bar chart representing scores from a substantial number of people:
(Multiple Choice)
4.9/5 (31)
Filters
- Essay(0)
- Multiple Choice(0)
- Short Answer(0)
- True False(0)
- Matching(0)