Exam 21: Sizing up the Economy Using Gdp
Exam 1: The Core Principles of Economics156 Questions
Exam 2: Demand: Thinking Like a Buyer165 Questions
Exam 3: Supply: Thinking Like a Seller168 Questions
Exam 4: Equilibrium: Where Supply Meets Demand191 Questions
Exam 5: Elasticity: Measuring Responsiveness182 Questions
Exam 6: When Governments Intervene in Markets265 Questions
Exam 7: Welfare and Efficiency208 Questions
Exam 8: Gains From Trade161 Questions
Exam 9: International Trade215 Questions
Exam 10: Externalities and Public Goods241 Questions
Exam 11: Labor Demand and Supply223 Questions
Exam 12: Wages, Workers, and Management154 Questions
Exam 13: Inequality, Social Insurance, and Redistribution190 Questions
Exam 14: Market Structure and Market Power216 Questions
Exam 15: Entry, Exit, and Long-Run Profitability217 Questions
Exam 16: Business Strategy148 Questions
Exam 17: Sophisticated Pricing Strategies170 Questions
Exam 18: Game Theory and Strategic Choices227 Questions
Exam 19: Decisions Involving Uncertainty201 Questions
Exam 20: Decisions With Private Information156 Questions
Exam 21: Sizing up the Economy Using Gdp204 Questions
Exam 22: Economic Growth137 Questions
Exam 23: Unemployment167 Questions
Exam 24: Inflation and Money158 Questions
Exam 25: Consumption and Saving158 Questions
Exam 26: Investment150 Questions
Exam 27: The Financial Sector137 Questions
Exam 28: International Finance and the Exchange Rate129 Questions
Exam 29: Business Cycles149 Questions
Exam 30: IS-MP Analysis: Interest Rates and Output123 Questions
Exam 31: Phillips Curve131 Questions
Exam 32: The Fed Model: Linking Interest Rates, Output, and Inflation125 Questions
Exam 33: Aggregate Demand and Aggregate Supply169 Questions
Exam 34: Monetary Policy130 Questions
Exam 35: Government Spending, Taxes, and Fiscal Policy178 Questions
Exam 36: Appendix: Aggregate Expenditure and the Multiplier78 Questions
Select questions type
According to the rule of 70, if GDP per person is growing at a rate of roughly 1.5%, approximately how many years will it take for average income to double?
(Multiple Choice)
4.8/5  (36)
(36)
(Table: Real and Nominal Output) Use Table: Real and Nominal Output. Nominal output in year 4 is: Year Units of Output Price per Unit 1 40 \ 1 2 30 \ 2 3 50 \ 2 4 70 \ 4 5 60 \ 6 6 60 \ 8
(Multiple Choice)
4.8/5 (31)
(Table: Price and Output Data) Use Table: Price and Output Data. The value of year 2's output in real dollars is: Year Output Price per Unit 1 2 \ 2 2 3 4 3= base period 4 5 4 6 6 5 7 9
(Multiple Choice)
4.8/5 (33)
How can GDP be total expenditure, total output, and total income at the same time?
(Essay)
4.8/5 (41)
This question has two parts.
(a) Draw and label a circular flow diagram.
(b) What are the key lessons learned from a circular flow diagram?
(Essay)
4.8/5 (42)
You own and run a bakery. Last month, you purchased $760 worth of flour, eggs, butter, chocolate, and frosting. Using these inputs, you made and sold 12 large wedding cakes for an average price of $525. How much did GDP change?
(Multiple Choice)
4.8/5 (39)
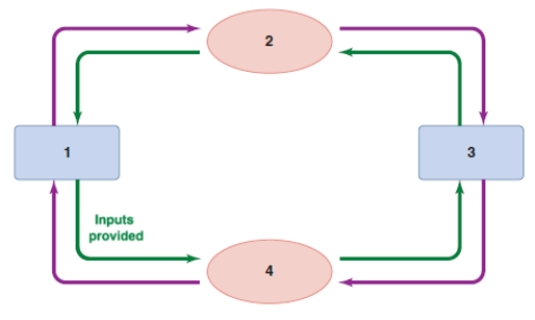
Refer to the diagram of the circular flow of income. Based on the diagram, box 2 must be:
(Multiple Choice)
4.8/5 (38)
According to the rule of 70, if GDP per person is growing at a rate of roughly 3.4%, approximately how many years will it take for average income to double?
(Multiple Choice)
4.9/5 (38)
(Table: Pizza Economy III) Use Table: Pizza Economy III. Considering 2018 as the base year, real GDP in 2019 was: 2018 Units of Output 2018 Price per Unit 2019 Units of Output 2019 Price per Unit Gino's Pizza 4,000 \ 10 4,000 \ 8 Bee's Spaghetti 3,000 \ 9 1,000 \ 6 Claudia's Cookies 2,000 \ 6 1,000 \ 1 Andre's Salad 5,000 \ 7 2,000 \ 4
(Multiple Choice)
4.8/5 (34)
The circular flow of income shows that total spending is _____ total income.
(Multiple Choice)
4.9/5 (33)
During 2000 and 2001, nominal GDP in the United States grew by 3.2%, and the rate of inflation was 2.2%. What was the growth rate of real GDP between the two years?
(Multiple Choice)
4.7/5 (36)
Consider the data shown in the table. Assume that the economy produces only barrels of oil. What is the nominal GDP for this year?
Barrels of Oil Sold Actual Price Last year 80,000 \ 60 This year 83,000 \ 63
(Multiple Choice)
4.9/5 (35)
Assume that in the base year, 2019, a country's nominal GDP is $10,000 billion. The country has had 5% inflation each year since 2014. Real GDP in 2019 is:
(Multiple Choice)
4.8/5 (34)
During 2017 and 2018, nominal GDP in the United States grew by 4.3%, and the rate of inflation was 1.9%. What was the growth rate of real GDP between the two years?
(Multiple Choice)
4.7/5 (33)
If India's GDP is approximately $2.597 trillion, and the population is 1.339 billion, what is the approximate GDP per person?
(Short Answer)
4.9/5 (42)
In 2019, consumer spending was $7,000, government purchases of goods and services was $2,500, and investment spending was $1,500. If GDP for 2019 was $10,300, exports were _____ and imports were _____.
(Multiple Choice)
4.7/5 (31)
Filters
- Essay(0)
- Multiple Choice(0)
- Short Answer(0)
- True False(0)
- Matching(0)