Exam 21: Sizing up the Economy Using Gdp
Exam 1: The Core Principles of Economics156 Questions
Exam 2: Demand: Thinking Like a Buyer165 Questions
Exam 3: Supply: Thinking Like a Seller168 Questions
Exam 4: Equilibrium: Where Supply Meets Demand191 Questions
Exam 5: Elasticity: Measuring Responsiveness182 Questions
Exam 6: When Governments Intervene in Markets265 Questions
Exam 7: Welfare and Efficiency208 Questions
Exam 8: Gains From Trade161 Questions
Exam 9: International Trade215 Questions
Exam 10: Externalities and Public Goods241 Questions
Exam 11: Labor Demand and Supply223 Questions
Exam 12: Wages, Workers, and Management154 Questions
Exam 13: Inequality, Social Insurance, and Redistribution190 Questions
Exam 14: Market Structure and Market Power216 Questions
Exam 15: Entry, Exit, and Long-Run Profitability217 Questions
Exam 16: Business Strategy148 Questions
Exam 17: Sophisticated Pricing Strategies170 Questions
Exam 18: Game Theory and Strategic Choices227 Questions
Exam 19: Decisions Involving Uncertainty201 Questions
Exam 20: Decisions With Private Information156 Questions
Exam 21: Sizing up the Economy Using Gdp204 Questions
Exam 22: Economic Growth137 Questions
Exam 23: Unemployment167 Questions
Exam 24: Inflation and Money158 Questions
Exam 25: Consumption and Saving158 Questions
Exam 26: Investment150 Questions
Exam 27: The Financial Sector137 Questions
Exam 28: International Finance and the Exchange Rate129 Questions
Exam 29: Business Cycles149 Questions
Exam 30: IS-MP Analysis: Interest Rates and Output123 Questions
Exam 31: Phillips Curve131 Questions
Exam 32: The Fed Model: Linking Interest Rates, Output, and Inflation125 Questions
Exam 33: Aggregate Demand and Aggregate Supply169 Questions
Exam 34: Monetary Policy130 Questions
Exam 35: Government Spending, Taxes, and Fiscal Policy178 Questions
Exam 36: Appendix: Aggregate Expenditure and the Multiplier78 Questions
Select questions type
For each of these scenarios, calculate the growth rate of real GDP.
(a) Inflation is 3%, and the growth rate of nominal GDP is 5%.
(b) Inflation is 2.5%, and the growth rate of nominal GDP is 6.5%.
(c) Inflation is 2%, and the growth rate of nominal GDP is 1%.
(Short Answer)
4.8/5  (36)
(36)
The LG Corporation produced 24,000 smartphones in 2019. Only 4,000 smartphones remained unsold at the end of 2019. As a result:
(Multiple Choice)
4.8/5 (41)
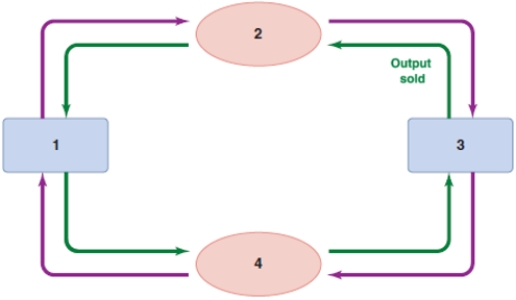
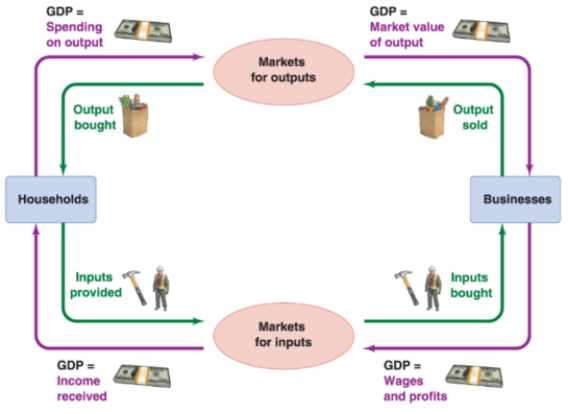
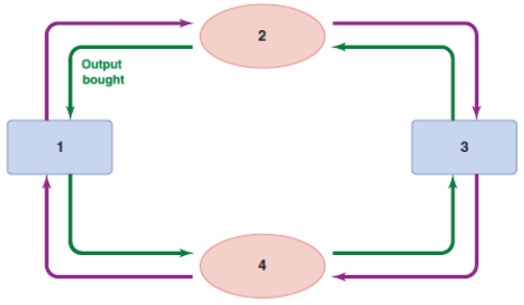
Refer to the diagram of the circular flow of income. Based on the diagram, the arrow going FROM box 2 to box 1 must be:

(Multiple Choice)
4.8/5 (39)
(Table: Lemonade and Cookies) Use Table: Lemonade and Cookies. Assume that an economy produces only lemonade and cookies. If 2018 is the base year, real GDP in 2018 was: 2018 Output 2018 Prices 2019 Output 2019 Prices Lemonade 200 glasses \1 per glass 220 glasses \1 per glass Cookies 100 cookies \2 per cookie 100 cookies \2 .25 per cookie
(Multiple Choice)
4.9/5 (39)
In 2017, Canada's GDP was approximately $1.57 trillion, and its population was about 36.96 million. What was Canada's approximate GDP per person in 2017?
(Multiple Choice)
4.9/5 (39)
During 1994 and 1995, nominal GDP in the United States grew by 4.8%, and the rate of inflation was 2.1%. What was the growth rate of real GDP between the two years?
(Multiple Choice)
4.9/5 (41)
Refer to the diagram of the circular flow of income. Based on the diagram, the arrow going FROM box 4 to box 3 must be:
(Multiple Choice)
4.8/5 (29)
Refer to the diagram of the circular flow of income. The key lessons from this diagram are that:
(i) all flows of resources are matched by flows of money.
(ii) the market value of total output must be equal to total spending.
(iii) total spending must equal total income.
(iv) all inputs are provided by businesses.
(Multiple Choice)
4.8/5 (32)
Consider the data shown in the table. Assume that the economy produces only barrels of oil. What is the nominal GDP for last year?
Barrels of Oil Sold Actual Price Last year 80,000 \ 60 This year 83,000 \ 63
(Multiple Choice)
4.8/5 (33)
Based on the following statistics, how much is consumption?
Total spending \ 11.62 trillion Investment \ 2.56 trillion Government spending \ 2.95 trillion Exports \ 1.80 trillion Imports \ 2.18 trillion
(Multiple Choice)
4.9/5 (34)
Consider the data shown in the table. Assume that the economy produces only textbooks. What is the real GDP for last year?
Textbooks Sold Actual Price Last year 5,000 \ 50 This year 5,250 \ 55
(Multiple Choice)
4.8/5 (35)
Refer to the diagram of the circular flow of income. Based on the diagram, box 1 must be:
(Multiple Choice)
4.8/5 (32)
Refer to the diagram of the circular flow of income. Based on the diagram, box 4 must be:

(Multiple Choice)
4.8/5 (40)
If the local construction company buys an industrial 3D printer, this expenditure is:
(Multiple Choice)
4.8/5 (42)
(Table: Per Capita GDP) Use Table: Per Capita GDP. If 2016 is the base year, real GDP in 2019 was: Year Nominal GDP Price Level Population \ 3,000 100 5 8,000 200 10
(Multiple Choice)
4.8/5 (40)
(Table: Pizza Economy III) Use Table: Pizza Economy III. Considering 2018 as the base year, given that the total population was 1,140 in 2018 and 1,380 in 2019, real GDP per capita between 2018 and 2019 grew at a rate of _____. 2018 Units of Output 2018 Price per Unit 2019 Units of Output 2019 Price per Unit Gino's Pizza 4,000 \ 10 4,000 \ 8 Bee's Spaghetti 3,000 \ 9 1,000 \ 6 Claudia's Cookies 2,000 \ 6 1,000 \ 1 Andre's Salad 5,000 \ 7 2,000 \ 4
(Multiple Choice)
4.8/5 (31)
In 1939, inflation in the United States was -1%, but at the same time, the country recorded a real GDP growth rate of 8%. What was the nominal GDP growth rate?
(Multiple Choice)
4.9/5 (41)
(Table: Smartwatch GDP in Singapore). Use Table: Smartwatch GDP in Singapore. Why is real GDP per capita used as a measure of a country's standard of living? What are some of the limitations of using real GDP as the only measure of a country's quality of life?
2018 Smartwatch Production 4,000 2018 Smartwatch Prices (base year) \ 500 2018 Population in Singapore 10,000 2019 Smartwatch Production 4,400 2019 Smartwatch Prices \ 600 2019 Population of Singapore 12,000
(Essay)
4.9/5 (33)
Consider the data shown in the table. Assume that the economy produces only textbooks. What is the real GDP for this year?
Textbooks Sold Actual Price Last year 5,000 \ 50 This year 5,250 \ 55
(Multiple Choice)
4.8/5 (29)
Filters
- Essay(0)
- Multiple Choice(0)
- Short Answer(0)
- True False(0)
- Matching(0)