Exam 21: Sizing up the Economy Using Gdp
Exam 1: The Core Principles of Economics156 Questions
Exam 2: Demand: Thinking Like a Buyer165 Questions
Exam 3: Supply: Thinking Like a Seller168 Questions
Exam 4: Equilibrium: Where Supply Meets Demand191 Questions
Exam 5: Elasticity: Measuring Responsiveness182 Questions
Exam 6: When Governments Intervene in Markets265 Questions
Exam 7: Welfare and Efficiency208 Questions
Exam 8: Gains From Trade161 Questions
Exam 9: International Trade215 Questions
Exam 10: Externalities and Public Goods241 Questions
Exam 11: Labor Demand and Supply223 Questions
Exam 12: Wages, Workers, and Management154 Questions
Exam 13: Inequality, Social Insurance, and Redistribution190 Questions
Exam 14: Market Structure and Market Power216 Questions
Exam 15: Entry, Exit, and Long-Run Profitability217 Questions
Exam 16: Business Strategy148 Questions
Exam 17: Sophisticated Pricing Strategies170 Questions
Exam 18: Game Theory and Strategic Choices227 Questions
Exam 19: Decisions Involving Uncertainty201 Questions
Exam 20: Decisions With Private Information156 Questions
Exam 21: Sizing up the Economy Using Gdp204 Questions
Exam 22: Economic Growth137 Questions
Exam 23: Unemployment167 Questions
Exam 24: Inflation and Money158 Questions
Exam 25: Consumption and Saving158 Questions
Exam 26: Investment150 Questions
Exam 27: The Financial Sector137 Questions
Exam 28: International Finance and the Exchange Rate129 Questions
Exam 29: Business Cycles149 Questions
Exam 30: IS-MP Analysis: Interest Rates and Output123 Questions
Exam 31: Phillips Curve131 Questions
Exam 32: The Fed Model: Linking Interest Rates, Output, and Inflation125 Questions
Exam 33: Aggregate Demand and Aggregate Supply169 Questions
Exam 34: Monetary Policy130 Questions
Exam 35: Government Spending, Taxes, and Fiscal Policy178 Questions
Exam 36: Appendix: Aggregate Expenditure and the Multiplier78 Questions
Select questions type
Below is economic data for Germany for 2016 (measured in billions of current euros). What was total spending?
Consumption 1,649.79 Investment 636.42 Government spending 620.01 Exports 1,442.41 Imports 1,211.64
(Multiple Choice)
4.9/5  (33)
(33)
(Scenario: Good A and Good B). The town of York produces two goods, good A and good B. The following is information regarding York's production of these two goods and their prices over three years. With 2017 as the base year, real GDP in 2017 was _____ GDP in _____. Year 2017 Year 2018 Year 2019 Quantity of good A 3 4 5 Price of good A \ 500 \ 550 \ 550 Quantity of good B 10 10 10 Price of good B \ 2 \ 4 \ 5
(Multiple Choice)
4.9/5 (44)
(Table: Real and Nominal Output) Use Table: Real and Nominal Output. Assuming year 3 is the base year, the change in real output between years 3 and 4 is an increase of: Year Units of Output Price per Unit 1 40 \ 1 2 30 \ 2 3 50 \ 2 4 70 \ 4 5 60 \ 6 6 60 \ 8
(Multiple Choice)
4.8/5 (34)
(Table: Price and Output Data) Use Table: Price and Output Data. The value of year 4's output in nominal dollars is: Year Output Price per Unit 1 2 \ 2 2 3 4 3= base period 4 5 4 6 6 5 7 9
(Multiple Choice)
4.7/5 (36)
Suppose that, in year 1, an economy produces 200 golf balls that sell for $3 each and 75 pizzas that sell for $8 each. The next year, the economy produces 210 golf balls that sell for $3.50 each and 80 pizzas that sell for $9 each. The growth rate of nominal GDP is ____.
(Multiple Choice)
4.9/5 (33)
A city experiences a rise in economic growth due to improvements in technology, but at the same time, there is increasing consumption of illegal drugs. What shortcoming of GDP measurement does this finding reflect?
(Multiple Choice)
4.8/5 (39)
Consider the data shown in the table. Assume that the economy produces only textbooks. What is the average price level between the two years?
Textbooks Sold Actual Price Last year 5,000 \ 50 This year 5,250 \ 55
(Multiple Choice)
4.9/5 (33)
(Table: Per Capita GDP) Use Table: Per Capita GDP. The growth rate of per capita nominal GDP was: Year Nominal GDP Price Level Population \ 3,000 100 5 8,000 200 10
(Multiple Choice)
4.8/5 (41)
In 1945, the United States recorded real GDP growth of -1% and nominal GDP growth of 1.6%. What was the inflation rate in 1945?
(Multiple Choice)
4.8/5 (39)
(Table: Real and Nominal Output) Use Table: Real and Nominal Output. Assuming year 3 is the base year, real output in year 3 is: Year Units of Output Price per Unit 1 40 \ 1 2 30 \ 2 3 50 \ 2 4 70 \ 4 5 60 \ 6 6 60 \ 8
(Multiple Choice)
4.8/5 (43)
In the United States, consumer spending accounts for approximately _____ of GDP.
(Multiple Choice)
4.8/5 (44)
(Table: Real and Nominal Output) Use Table: Real and Nominal Output. Nominal output in year 3 is: Year Units of Output Price per Unit 1 40 \ 1 2 30 \ 2 3 50 \ 2 4 70 \ 4 5 60 \ 6 6 60 \ 8
(Multiple Choice)
4.8/5 (36)
Which of the following is an example of a transfer payment?
(Multiple Choice)
4.9/5 (40)
Consider the data shown in the table. Assume that the economy produces only barrels of oil. What is the growth rate of real GDP between the two years?
Barrels of Oil Sold Actual Price Last year 80,000 \ 60 This year 83,000 \ 63
(Multiple Choice)
4.8/5 (41)
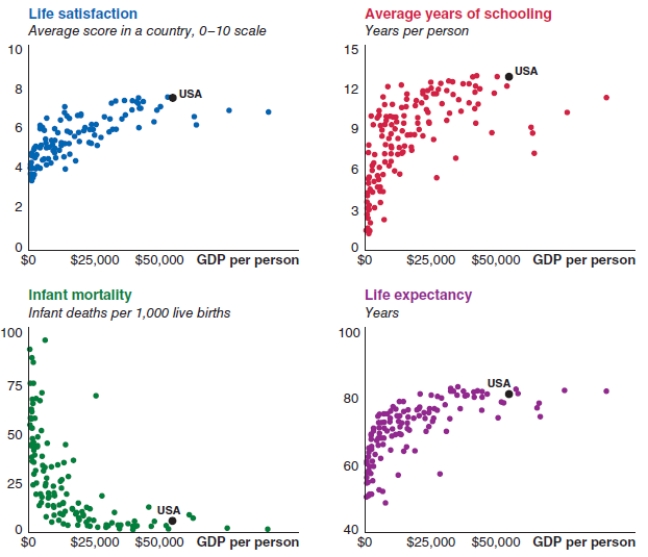
Consider the following graphs, which are discussed in the textbook. Focus on the graph that looks at the relationship between GDP per person and infant deaths per 1,000 live births. What can explain this relationship?
(Multiple Choice)
4.8/5 (33)
Table: Measuring GDP. Use Table: Measuring GDP. Total expenditures on GDP by the household sector are: { \text { Measuring GDP (billions of dollars) } } \\
\begin{array} { | l | l | }
\hline \text { Personal consumption expenditures } & \$ 600 \\
\hline \text { Gross private domestic investment } & 200 \\
\hline \text { Net exports } & - 5 \\
\hline \text { State and local government purchases of goods and services } & 200 \\
\hline \text { Federal government purchases of goods and services } & 100 \\
\hline \text { Imports } & 15 \\
\hline
\end{array}
(Multiple Choice)
4.7/5 (38)
Consider the data shown in the table. Assume that the economy produces only barrels of oil. What is the real GDP for this year using last year as the base year?
Barrels of Oil Sold Actual Price Last year 80,000 \ 60 This year 83,000 \ 63
(Multiple Choice)
4.9/5 (41)
Filters
- Essay(0)
- Multiple Choice(0)
- Short Answer(0)
- True False(0)
- Matching(0)