Exam 21: Sizing up the Economy Using Gdp
Exam 1: The Core Principles of Economics156 Questions
Exam 2: Demand: Thinking Like a Buyer165 Questions
Exam 3: Supply: Thinking Like a Seller168 Questions
Exam 4: Equilibrium: Where Supply Meets Demand191 Questions
Exam 5: Elasticity: Measuring Responsiveness182 Questions
Exam 6: When Governments Intervene in Markets265 Questions
Exam 7: Welfare and Efficiency208 Questions
Exam 8: Gains From Trade161 Questions
Exam 9: International Trade215 Questions
Exam 10: Externalities and Public Goods241 Questions
Exam 11: Labor Demand and Supply223 Questions
Exam 12: Wages, Workers, and Management154 Questions
Exam 13: Inequality, Social Insurance, and Redistribution190 Questions
Exam 14: Market Structure and Market Power216 Questions
Exam 15: Entry, Exit, and Long-Run Profitability217 Questions
Exam 16: Business Strategy148 Questions
Exam 17: Sophisticated Pricing Strategies170 Questions
Exam 18: Game Theory and Strategic Choices227 Questions
Exam 19: Decisions Involving Uncertainty201 Questions
Exam 20: Decisions With Private Information156 Questions
Exam 21: Sizing up the Economy Using Gdp204 Questions
Exam 22: Economic Growth137 Questions
Exam 23: Unemployment167 Questions
Exam 24: Inflation and Money158 Questions
Exam 25: Consumption and Saving158 Questions
Exam 26: Investment150 Questions
Exam 27: The Financial Sector137 Questions
Exam 28: International Finance and the Exchange Rate129 Questions
Exam 29: Business Cycles149 Questions
Exam 30: IS-MP Analysis: Interest Rates and Output123 Questions
Exam 31: Phillips Curve131 Questions
Exam 32: The Fed Model: Linking Interest Rates, Output, and Inflation125 Questions
Exam 33: Aggregate Demand and Aggregate Supply169 Questions
Exam 34: Monetary Policy130 Questions
Exam 35: Government Spending, Taxes, and Fiscal Policy178 Questions
Exam 36: Appendix: Aggregate Expenditure and the Multiplier78 Questions
Select questions type
Assume that the real GDP of the United States is approximately $21 trillion and that the population of the United States is approximately 350 million. What is real GDP per capita?
(Multiple Choice)
4.7/5  (37)
(37)
Answer the following questions regarding big numbers.
(a) The U.S. population is about 330 million people. What is this number in billions?
(b) China's population is about 1.393 billion people. What is this number in millions?
(c) Indonesia's population, measured in thousands, is 268,000 people. What is this number in millions?
(Short Answer)
4.8/5 (42)
What is the difference between output from a microeconomic standpoint versus output from a macroeconomic standpoint?
(Multiple Choice)
4.7/5 (32)
(Table: Price and Output Data) Use Table: Price and Output Data. Real GDP in year 5 is: Year Output Price per Unit 1 2 \ 2 2 3 4 3= base period 4 5 4 6 6 5 7 9
(Multiple Choice)
4.9/5 (38)
(Table: Pizza Economy III) Use Table: Pizza Economy III. Considering 2018 as the base year, given that the total population was 1,140 in 2018 and 1,380 in 2019, real GDP per capita in 2018 was: 2018 Units of Output 2018 Price per Unit 2019 Units of Output 2019 Price per Unit Gino's Pizza 4,000 \ 10 4,000 \ 8 Bee's Spaghetti 3,000 \ 9 1,000 \ 6 Claudia's Cookies 2,000 \ 6 1,000 \ 1 Andre's Salad 5,000 \ 7 2,000 \ 4
(Multiple Choice)
4.9/5 (39)
In 2004, Canada's GDP was approximately $1.13 trillion, and its population was about 32 million. What was Canada's approximate GDP per person in 2004?
(Multiple Choice)
4.7/5 (33)
(Table: Lemonade and Cookies) Use Table: Lemonade and Cookies. Assume that an economy produces only lemonade and cookies. Nominal GDP in 2018 was: 2018 Output 2018 Prices 2019 Output 2019 Prices Lemonade 200 glasses \1 per glass 220 glasses \1 per glass Cookies 100 cookies \2 per cookie 100 cookies \2 .25 per cookie
(Multiple Choice)
4.9/5 (32)
(Table: Peanut Butter and Jelly Economy) Use Table: Peanut Butter and Jelly Economy. How much of the increase in nominal GDP between 2018 and 2019 was due to inflation? Product 2018 Output 2018 Prices (base year) Product 2019 Output 2019 Prices Peanut butter 200 units \1 per unit Peanut butter 250 \ 1.10 per unit Jelly 100 units 2 per unit Jelly 100 2.50 per unit
(Multiple Choice)
4.8/5 (41)
(Table: Per Capita GDP) Use Table: Per Capita GDP. Per capita real GDP in 2019 was: Year Nominal GDP Price Level Population \ 3,000 100 5 8,000 200 10
(Multiple Choice)
4.8/5 (34)
Consider the data shown in the table. Assume that the economy produces only frozen fish. What is the nominal GDP for this year?
Tons of Frozen Fish Sold Actual Price Last year 100 \ 1,800 This year 105 \ 1,850
(Multiple Choice)
4.9/5 (40)
The underlying principle of the circular flow diagram is that the flows of money into each sector or market in the economy are _____ those coming out of the sector or market.
(Multiple Choice)
4.8/5 (42)
When your household buys goods and services, this is called:
(Multiple Choice)
4.7/5 (32)
(Table: Peanut Butter and Jelly Economy) Use Table: Peanut Butter and Jelly Economy. Nominal GDP in 2018 was: Product 2018 Output 2018 Prices (base year) Product 2019 Output 2019 Prices Peanut butter 200 units \1 per unit Peanut butter 250 \1 .10 per unit Jelly 100 units 2 per unit Jelly 100 2.50 per unit
(Multiple Choice)
4.7/5 (32)
Consider the following graphs, which are discussed in the textbook. Focus on the graph that looks at the relationship between GDP per person and life expectancy. What can explain this relationship?
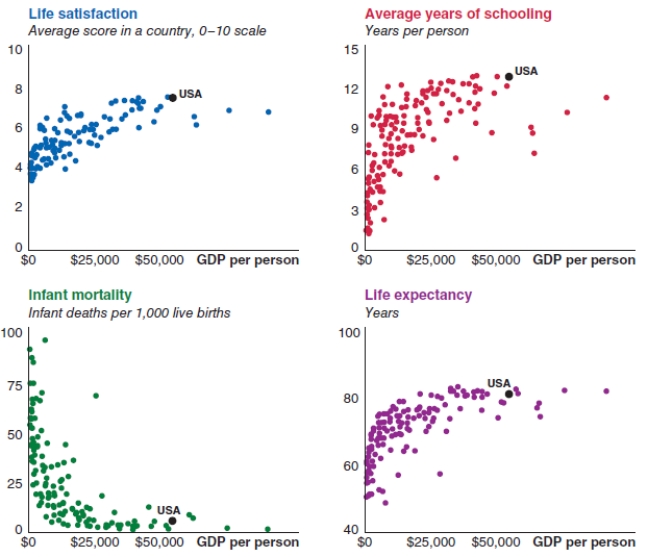
(Multiple Choice)
4.8/5 (40)
(Table: Smartwatch GDP in Singapore). Use Table: Smartwatch GDP in Singapore. Why is real GDP per capita used as a measure of a country's standard of living? What are some of the limitations of using real GDP as the only measure of a country's quality of life?
2018 Smartwatch Production 4,000 2018 Smartwatch Prices (base year) \ 500 2018 Population in Singapore 10,000 2019 Smartwatch Production 4,400 2019 Smartwatch Prices \ 600 2019 Population of Singapore 12,000
(Essay)
5.0/5 (45)
When the U.S. government buys goods and services, this is called:
(Multiple Choice)
4.9/5 (37)
If an economy's GDP is $3.179 trillion and the population is 25 million, what is the approximate GDP per person?
(Short Answer)
4.8/5 (41)
For each of these scenarios, calculate the inflation rate.
(a) Real GDP growth is -2.2%, and nominal GDP growth is -1.5%.
(b) Real GDP growth is 2.5%, and nominal GDP growth is 5.2%.
(c) Real GDP growth is 2.3%, and nominal GDP growth is 4.2%.
(Short Answer)
4.8/5 (40)
Filters
- Essay(0)
- Multiple Choice(0)
- Short Answer(0)
- True False(0)
- Matching(0)