Exam 7: Theoretical Distributions Including the Normal Distribution
Exam 1: Introduction211 Questions
Exam 2: Exploring Data: Frequency Distributions and Graphs94 Questions
Exam 3: Exploring Data: Central Tendency103 Questions
Exam 4: Exploring Data: Variability137 Questions
Exam 5: Other Descriptive Statistics188 Questions
Exam 6: Correlation and Regression170 Questions
Exam 7: Theoretical Distributions Including the Normal Distribution138 Questions
Exam 8: Samples, Sampling Distributions, and Confidence Intervals162 Questions
Exam 9: Hypothesis Testing and Effect Size: One-Sample Designs157 Questions
Exam 10: Hypothesis Testing, Effect Size, and and Confidence Intervals: Two-Sample Designs206 Questions
Exam 11: Analysis of Variance: One-Way Classification176 Questions
Exam 12: Analysis of Variance: One-Factor Repeated Measures105 Questions
Exam 13: Analysis of Variance: Factorial Design148 Questions
Exam 14: Chi Square Tests147 Questions
Exam 15: More Nonparametric Tests150 Questions
Exam 16: Appendix: Grouped Frequency Distributions and Central Tendency21 Questions
Select questions type
Bud and Lou were arguing about scores on the Ace Slap-Stick Comedy Test. These scores are distributed normally with a mean of 50. They agreed that 10% of the population had scores of 60 or better (and they were correct on this). Bud also claimed that 10% of the population had scores of 40 or below.
(Multiple Choice)
4.9/5  (33)
(33)
Please do not use your table in answering this question. .3849 of the normal curve falls between and 1.2 . The proportion between and .6 is
(Multiple Choice)
4.8/5 (38)
Data Set 7-3: A population of scores was normally distributed with a mean of 32 and a standard deviation of 3.
-Look at Data Set 7-3. The proportion that scored between 30 and 27 is
(Multiple Choice)
4.9/5 (42)
Data Set 7-2: In the Fall of 1902 there were 184 seniors, 179 juniors, 267 sophomores, and 353 freshmen enrolled at a small college.
-Data Set 7-2 is
(Multiple Choice)
4.8/5 (33)
According to your text the following data are distributed normally.
(Multiple Choice)
4.9/5 (32)
The mean and the standard deviation of the normal curve in Table C in your textbook are
(Multiple Choice)
4.8/5 (44)
The proportion of the area of the normal curve between 1.0 and 1.5 is ___________________the proportion between 0.5 and 1.0 .
(Multiple Choice)
4.8/5 (31)
Data Set 7-1: Suppose an urn (a kind of jar that seems to be the best natural habitat for marbles) contained 3 red, 6 black, 5 blue, 2 yellow and 4 green marbles.
-Refer to Data Set 7-1. The probability of drawing a marble that is red, yellow, black or green is
(Multiple Choice)
4.8/5 (43)
Here is a question based on the footnotes in the chapter. Pick the true statement from the four below.
(Multiple Choice)
4.7/5 (41)
A common technique in the field of testing is to design the test so that it will have a mean of 50 and a standard deviation of 10. Examples are the MMPI (Minnesota Multiphasic Personality Inventory), CPI (California Personality Inventory), and the Tennessee Self-Concept Scale. (Perhaps when you become a famous test maker, you'll name your test after your school.)
a. The manual for the MMPI says that there is clinical significance to scores that are two standard deviations above the mean. From a thousand persons how many would be expected to get a clinical label?
b. What proportion would be expected to score 68 and above?
c. What proportion would be expected to score between 53 and 63?
d. What score separates out the lowest one-fifth?
(Essay)
4.8/5 (38)
A common technique in the field of testing is to arrange scores so that a test will have a mean of 50 and a standard deviation of 10. For such a test,
a. what scores separate the middle 25% from the rest?
b. what proportion would be expected to score 68 and above?
c. what proportion would be expected to score between 45 and 55?
d. what proportion would be expected to score between 55 and 65?
e. what proportion score above 35?
f. what score separates the top third on such a test?
(Essay)
4.9/5 (35)
Data Set 7-6, a theoretical distribution: 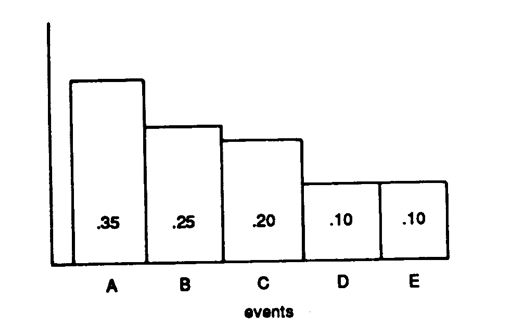 -Look at Data Set 7-6. This distribution is
(Multiple Choice)
4.9/5 (37)
Data Set 7-3: A population of scores was normally distributed with a mean of 32 and a standard deviation of 3.
-Look at Data Set 7-3. The proportion of the distribution with scores of 30 or more is
(Multiple Choice)
4.8/5 (31)
Suppose that if k should occur, it will be called a success. If j should occur, it will be called a failure. The ratio k/(k+j) is
(Multiple Choice)
4.8/5 (35)
Extreme scores on the normal curve are those between the mean and the median.
(True/False)
4.9/5 (31)
The size of the area of the theoretical distributions described in Chapter 7 depends on the size of the population.
(True/False)
4.7/5 (26)
Filters
- Essay(0)
- Multiple Choice(0)
- Short Answer(0)
- True False(0)
- Matching(0)