Exam 15: Monopoly
Exam 1: Ten Principles of Economics237 Questions
Exam 2: Thinking Like an Economist267 Questions
Exam 3: Interdependence and the Gains From Trade217 Questions
Exam 4: The Market Forces of Supply and Demand303 Questions
Exam 5: Elasticity and Its Applications282 Questions
Exam 6: Supply, demand, and Government Policies252 Questions
Exam 7: Consumers, producers, and the Efficiency of Markets248 Questions
Exam 8: Application: the Costs of Taxation245 Questions
Exam 9: Application: International Trade245 Questions
Exam 10: Externalities288 Questions
Exam 11: Public Goods and Common Resources258 Questions
Exam 12: The Design of the Tax System328 Questions
Exam 13: The Costs of Production303 Questions
Exam 14: Firms in Competitive Markets271 Questions
Exam 15: Monopoly306 Questions
Exam 16: Oligopoly291 Questions
Exam 17: Monopolistic Competition257 Questions
Exam 18: The Markets for the Factors of Production284 Questions
Exam 19: Earnings and Discrimination286 Questions
Exam 20: Income Inequality and Poverty247 Questions
Exam 21: The Theory of Consumer Choice238 Questions
Exam 22: Frontiers of Microeconomics199 Questions
Exam 23: Measuring a Nations Income215 Questions
Exam 24: Measuring the Cost of Living208 Questions
Exam 25: Production and Growth240 Questions
Exam 26: Saving, investment, and the Financial System282 Questions
Exam 27: The Basic Tools of Finance249 Questions
Exam 28: Unemployment242 Questions
Exam 29: The Monetary System277 Questions
Exam 30: Money Growth and Inflation224 Questions
Exam 31: Open-Economy Macroeconomics: Basic Concepts256 Questions
Exam 32: A Macroeconomic Theory of the Open Economy217 Questions
Exam 33: Aggregate Demand and Aggregate Supply302 Questions
Exam 34: The Influence of Monetary and Fiscal Policy on Aggregate Demand249 Questions
Exam 35: The Short Run Trade Off Between Inflation and Unemployment246 Questions
Exam 36: Five Debates Over Macroeconomic Policy140 Questions
Select questions type
In the diagram below,which area represents the deadweight loss from monopoly? 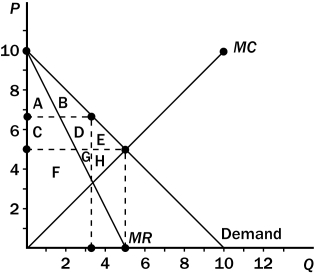
Free
(Multiple Choice)
4.9/5  (41)
(41)
Correct Answer: Verified
D
Figure 15-7
The figure below depicts the demand, marginal revenue, and marginal cost curves of a profit-maximizing monopolist.
 -Refer to Figure 15-7.If the monopoly firm is NOT allowed to price discriminate,then the deadweight loss amounts to
Free
(Multiple Choice)
4.8/5 (37)
Correct Answer:Verified
D
Why might economists prefer private ownership of monopolies over public ownership of monopolies?
Free
(Essay)
4.9/5 (37)
Correct Answer:Verified
The private monopolist is governed by the market.Even though the market solution is sub-optimal,it may be better than outcomes generated by publicly owned monopolies.Publicly owned monopolies may restrict output to levels below the private market outcome and thus generate an even lower level of social surplus than a private profit-maximizing monopolist.They also may not work to reduce costs.
A profit-maximizing monopolist will produce the level of output at which
(Multiple Choice)
4.9/5 (32)
The deadweight loss that arises from a monopoly is a consequence of the fact that the monopoly
(Multiple Choice)
4.8/5 (36)
For a monopolist,when does marginal revenue exceed average revenue?
(Multiple Choice)
4.8/5 (36)
The legislation passed by Congress in 1890 to reduce the market power of large and powerful "trusts" is called the
(Multiple Choice)
4.8/5 (38)
Figure 15-3
The figure below illustrates the cost and revenue structure for a monopoly firm.
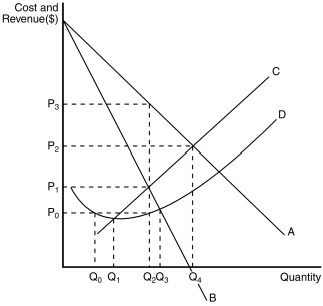 -Refer to Figure 15-3.A profit-maximizing monopoly's total revenue is equal to
(Multiple Choice)
4.8/5 (36)
Figure 15-2
The figure below illustrates the cost and revenue structure for a monopoly firm.
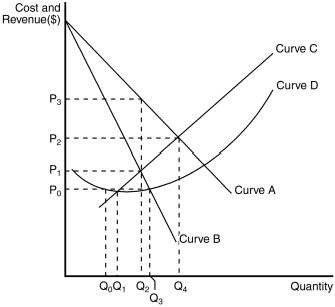 -Refer to Figure 15-2.The demand curve for a monopoly firm is depicted by curve
(Multiple Choice)
4.9/5 (39)
What do economists call the business practice of selling the same good at difference prices to different customers?
(Multiple Choice)
4.8/5 (33)
The problem with monopolies is their ability (i) to do away with barriers to entry.
(ii) to price their product at a level that exceeds marginal cost.
(iii) to restrict output below the socially efficient level of production.
(Multiple Choice)
5.0/5 (34)
What is the monopolist's profit under the following conditions? The profit-maximizing price charged for goods produced is $12.The intersection of the marginal revenue and marginal cost curves occurs where output is 10 units and marginal cost is $6.Average total cost for 10 units of output is $5.
(Multiple Choice)
4.9/5 (25)
When a firm's average total cost curve continually declines,the firm is a
(Multiple Choice)
4.9/5 (35)
The collection of statutes aimed at curbing monopoly power is called
(Multiple Choice)
4.9/5 (35)
The amount that producers receive for a good minus their costs of producing it equals
(Multiple Choice)
5.0/5 (38)
Angelo is a wholesale meatball distributor.He sells his meatballs to all the finest Italian restaurants in town.Nobody can make meatballs like Angelo.As a result,his is the only business in town that sells meatballs to restaurants.Assuming that Angelo is maximizing his profit,which of the following statements is true?
(Multiple Choice)
4.9/5 (32)
Figure 15-3
The figure below illustrates the cost and revenue structure for a monopoly firm.
-Refer to Figure 15-3.At the profit-maximizing level of output,
(Multiple Choice)
4.7/5 (29)
When a single firm can supply a product to an entire market at a smaller cost than could two or more firms,the industry is called a
(Multiple Choice)
4.8/5 (28)
Filters
- Essay(0)
- Multiple Choice(0)
- Short Answer(0)
- True False(0)
- Matching(0)