Exam 8: Application: the Costs of Taxation
Exam 1: Ten Principles of Economics237 Questions
Exam 2: Thinking Like an Economist267 Questions
Exam 3: Interdependence and the Gains From Trade217 Questions
Exam 4: The Market Forces of Supply and Demand303 Questions
Exam 5: Elasticity and Its Applications282 Questions
Exam 6: Supply, demand, and Government Policies252 Questions
Exam 7: Consumers, producers, and the Efficiency of Markets248 Questions
Exam 8: Application: the Costs of Taxation245 Questions
Exam 9: Application: International Trade245 Questions
Exam 10: Externalities288 Questions
Exam 11: Public Goods and Common Resources258 Questions
Exam 12: The Design of the Tax System328 Questions
Exam 13: The Costs of Production303 Questions
Exam 14: Firms in Competitive Markets271 Questions
Exam 15: Monopoly306 Questions
Exam 16: Oligopoly291 Questions
Exam 17: Monopolistic Competition257 Questions
Exam 18: The Markets for the Factors of Production284 Questions
Exam 19: Earnings and Discrimination286 Questions
Exam 20: Income Inequality and Poverty247 Questions
Exam 21: The Theory of Consumer Choice238 Questions
Exam 22: Frontiers of Microeconomics199 Questions
Exam 23: Measuring a Nations Income215 Questions
Exam 24: Measuring the Cost of Living208 Questions
Exam 25: Production and Growth240 Questions
Exam 26: Saving, investment, and the Financial System282 Questions
Exam 27: The Basic Tools of Finance249 Questions
Exam 28: Unemployment242 Questions
Exam 29: The Monetary System277 Questions
Exam 30: Money Growth and Inflation224 Questions
Exam 31: Open-Economy Macroeconomics: Basic Concepts256 Questions
Exam 32: A Macroeconomic Theory of the Open Economy217 Questions
Exam 33: Aggregate Demand and Aggregate Supply302 Questions
Exam 34: The Influence of Monetary and Fiscal Policy on Aggregate Demand249 Questions
Exam 35: The Short Run Trade Off Between Inflation and Unemployment246 Questions
Exam 36: Five Debates Over Macroeconomic Policy140 Questions
Select questions type
Ronald Reagan believed that reducing income tax rates would
Free
(Multiple Choice)
4.7/5  (38)
(38)
Correct Answer: Verified
C
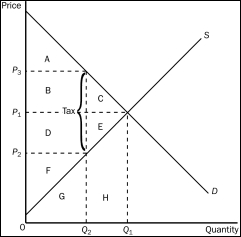
Figure 8-7 The graph below represents a $10 per unit tax on a good. On the graph, Q represents quantity and P represents price.
 -Refer to Figure 8-7.The tax causes consumer surplus to decrease by the area
Free
(Multiple Choice)
4.7/5 (35)
Correct Answer:Verified
B
The Laffer curve is the curve showing how tax revenue varies as the size of the tax varies.
Free
(True/False)
4.9/5 (28)
Correct Answer:Verified
True
The demand for bread is less elastic than the demand for donuts;hence,a tax on bread will create a larger deadweight loss than will the same tax on donuts,other things equal.
(True/False)
5.0/5 (39)
Figure 8-5
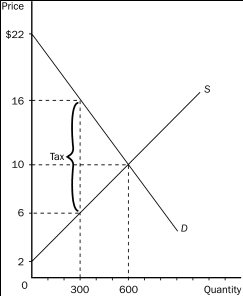 -Refer to Figure 8-5.Without a tax,consumer surplus in this market is
(Multiple Choice)
4.8/5 (35)
Figure 8-6
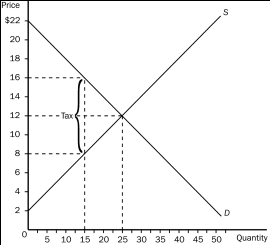 -Refer to Figure 8-6.Suppose a 20th unit of the good were sold by a seller to a buyer.Which of the following statements is correct?
(Multiple Choice)
4.7/5 (35)
The amount of deadweight loss that results from a tax of a given size is determined by the
(Multiple Choice)
5.0/5 (37)
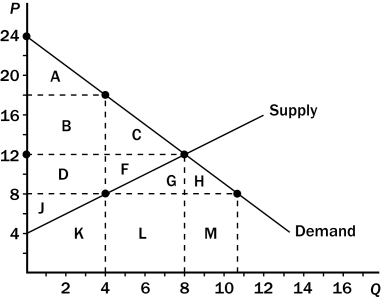
Figure 8-1
 -Refer to Figure 8-1.When the market is in equilibrium,total surplus is represented by area
(Multiple Choice)
4.9/5 (38)
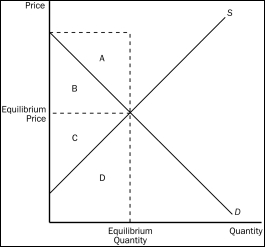
Figure 8-4
 -Refer to Figure 8-4.The tax causes a reduction in producer surplus that is represented by area
(Multiple Choice)
4.8/5 (29)
Figure 8-5
-Refer to Figure 8-5.When a tax is imposed in this market,consumer surplus is
(Multiple Choice)
4.8/5 (30)
The supply curve and the demand curve for a good are straight lines.When the good is taxed,the area on the relevant supply-and-demand graph that represents
(Multiple Choice)
4.8/5 (39)
Figure 8-7 The graph below represents a $10 per unit tax on a good. On the graph, Q represents quantity and P represents price.
-Refer to Figure 8-7.After the tax goes into effect,consumer surplus is the area
(Multiple Choice)
4.8/5 (29)
Suppose the tax on gasoline is raised from $0.50 per gallon to $2.50 per gallon.As a result,
(Multiple Choice)
4.9/5 (28)
Suppose a tax of $1 per unit is imposed on a good.The more elastic the demand for the good,other things equal,
(Multiple Choice)
4.8/5 (34)
Figure 8-5
-Refer to Figure 8-5.When a tax is imposed in this market,the price buyers effectively pay is
(Multiple Choice)
4.8/5 (36)
When Ronald Reagan ran for the presidency in 1980,he pledged to bring about
(Multiple Choice)
5.0/5 (34)
Filters
- Essay(0)
- Multiple Choice(0)
- Short Answer(0)
- True False(0)
- Matching(0)