Exam 2: Significance: How Strong Is the Evidence
Exam 1: Preliminaries: Introduction to Statistical Investigations46 Questions
Exam 2: Significance: How Strong Is the Evidence75 Questions
Exam 3: Generalization: How Broadly Do the Results Apply64 Questions
Exam 4: Estimation: How Large Is the Effect61 Questions
Exam 5: Causation: Can We Say What Caused the Effect30 Questions
Exam 6: Comparing Two Proportions46 Questions
Exam 7: Comparing Two Means46 Questions
Exam 8: Paired Data: One Quantitative Variable48 Questions
Exam 9: Comparing More Than Two Proportions46 Questions
Exam 10: Comparing More Than Two Means28 Questions
Exam 11: Two Quantitative Variables73 Questions
Exam 12: Modeling Randomness129 Questions
Select questions type
Suppose you are testing to see if your dog, Hope, understands pointing towards an object. You place two objects about 2.5 meters away, then you point towards one of the objects. In 20 trials, Hope goes to the correct object 13 times (or 65%).
-Fill in the blanks with the correct One Proportion applet inputs to carry out an appropriate simulation of this process, if Hope does not understand pointing towards an object and is just guessing.
Probability of success: _______
Sample size: _______
Number of samples: _______
Free
(Short Answer)
4.9/5  (37)
(37)
Correct Answer: Verified
0.5 , 20 , Any integer as larger or larger than 1000
The first iPhone became available for public purchase in 2007. By 2010, approximately 30% of smartphone users in the US owned an iPhone. Several new companies have entered the smartphone market since then and the folks at Apple want to know how they are stacking up against their competition. In 2019, a representative sample of 529 smartphone users in the US showed that 47.4% use an Apple iOS device. Does it appear that Apple's share of the US smartphone market has increased since 2010?
-What can we conclude about this study, based on the standardized statistic in 29? (If you didn't report a standardized statistic in 29, then use for this question.) 
Free
(Multiple Choice)
4.8/5 (37)
Correct Answer:Verified
B
Research done in the mid 1980s indicated that 80% of grizzly bears in the greater ecosystem of Yellowstone National Park entered their den for hibernation by the last day of November. This has come into question as of late. Researchers have hypothesized that climate change has postponed bears entering hibernation until later in the season; that is, researchers believe that a smaller percentage of bears are entering their den for hibernation by the last day of November. Sixty-two Yellowstone grizzly bears were tracked via radio monitors, which allow scientists to pinpoint when the bears enter their dens with a high degree of accuracy. Of the sixty-two Yellowstone grizzly bears being tracked, forty-two entered their den for hibernation by the last day of November.
-What values would you enter for each of the following in the One Proportion applet to conduct a simulation-based hypothesis test with these data?
Probability of success: _______
Sample size: _______
Number of samples: _______
Free
(Short Answer)
4.7/5 (33)
Correct Answer:Verified
0.8 , 62 , Any integer as larger or larger than 1000;
Do red uniform wearers tend to win more often than those wearing blue uniforms in Taekwondo matches where competitors are randomly assigned to wear either a red or blue uniform? In a sample of 80 Taekwondo matches, there were 45 matches where the red uni-form wearer won.
-Given below is the simulated distribution of the number of "red wins" that could happen by chance alone in a sample of 80 matches. Based on this simulation, is our observed result statistically significant? 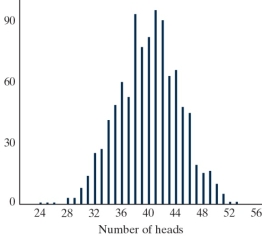
(Multiple Choice)
4.7/5 (33)
An environmental science teacher at a high school with a large population of students was curious whether the majority (more than half) of students at the school regularly recycle plastic bottles. The teacher selected a random sample of 146 students at the school to interview, then asked each student: "Do you recycle plastic bottles more often than you throw them in the trash?" (Yes/No). Suppose that 89 of the students answered "Yes".
-The sample proportion of students who said "Yes" was 0.55 instead of 0.61.
(Multiple Choice)
4.9/5 (30)
If an observed statistic is statistically significant, then we have strong evidence that the chance-alone explanation is correct.
(True/False)
4.8/5 (37)
An environmental science teacher at a high school with a large population of students was curious whether the majority (more than half) of students at the school regularly recycle plastic bottles. The teacher selected a random sample of 146 students at the school to interview, then asked each student: "Do you recycle plastic bottles more often than you throw them in the trash?" (Yes/No). Suppose that 89 of the students answered "Yes".
-We want to know if the proportion of students at the school that would have said "Yes" differed from 0.5 rather than was greater than 0.5.
(Multiple Choice)
4.8/5 (36)
The first iPhone became available for public purchase in 2007. By 2010, approximately 30% of smartphone users in the US owned an iPhone. Several new companies have entered the smartphone market since then and the folks at Apple want to know how they are stacking up against their competition. In 2019, a representative sample of 529 smartphone users in the US showed that 47.4% use an Apple iOS device. Does it appear that Apple's share of the US smartphone market has increased since 2010?
-What is the value of the statistic and its proper notation in this study?
(Multiple Choice)
5.0/5 (31)
Match each standardized statistic value with its corresponding p-value:
- _______
(Multiple Choice)
4.9/5 (34)
For each of the following scenarios, determine whether the alternative hypothesis would be one-sided or two-sided.
-Retired professional tennis players Martina Navratilova, Monica Seles, John McEnroe, and Jimmy Connors are all left-handed. About 10% of the general population is left-handed. Researchers are interested if the proportion of professional tennis players that are left-handed is larger than that of the general population.
(Multiple Choice)
4.9/5 (46)
When using the One Proportion applet, the simulated null distribution should be centered around the observed sample proportion.
(True/False)
4.8/5 (41)
Do red uniform wearers tend to win more often than those wearing blue uniforms in Taekwondo matches where competitors are randomly assigned to wear either a red or blue uniform? In a sample of 80 Taekwondo matches, there were 45 matches where the red uni-form wearer won.
-What is the parameter of interest for this study?
(Multiple Choice)
4.8/5 (41)
An environmental science teacher at a high school with a large population of students was curious whether the majority (more than half) of students at the school regularly recycle plastic bottles. The teacher selected a random sample of 146 students at the school to interview, then asked each student: "Do you recycle plastic bottles more often than you throw them in the trash?" (Yes/No). Suppose that 89 of the students answered "Yes".
-How could we use coins, a spinner, or cards to simulate one of the samples in the simulated null distribution? Select all that apply.
(Multiple Choice)
4.8/5 (42)
An environmental science teacher at a high school with a large population of students was curious whether the majority (more than half) of students at the school regularly recycle plastic bottles. The teacher selected a random sample of 146 students at the school to interview, then asked each student: "Do you recycle plastic bottles more often than you throw them in the trash?" (Yes/No). Suppose that 89 of the students answered "Yes".
-Would you consider the results of this test to be statistically significant?
(Multiple Choice)
4.8/5 (39)
If the standardized statistic is larger than 3, then the p-value will be larger than 0.10.
(True/False)
4.9/5 (27)
For each of the following scenarios, determine whether the alternative hypothesis would be one-sided or two-sided.
-A recent Gallup poll reported that 77% of Americans are at least 'somewhat' confident in the government's ability to handle a coronavirus outbreak. A student researcher is interested if students at their university are more skeptical (less likely to feel confident) than what was reported in the Gallup poll.
(Multiple Choice)
4.9/5 (25)
Do red uniform wearers tend to win more often than those wearing blue uniforms in Taekwondo matches where competitors are randomly assigned to wear either a red or blue uniform? In a sample of 80 Taekwondo matches, there were 45 matches where the red uniform wearer won. Given below is the simulated null distribution of proportion of "red wins" that could happen by chance alone in a sample of 80 matches. Also, given are the mean and SD for this null distribution. 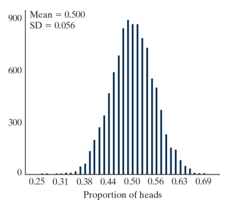 -What is the value of the standardized statistic?
(Multiple Choice)
4.8/5 (36)
Research done in the mid 1980s indicated that 80% of grizzly bears in the greater ecosystem of Yellowstone National Park entered their den for hibernation by the last day of November. This has come into question as of late. Researchers have hypothesized that climate change has postponed bears entering hibernation until later in the season; that is, researchers believe that a smaller percentage of bears are entering their den for hibernation by the last day of November. Sixty-two Yellowstone grizzly bears were tracked via radio monitors, which allow scientists to pinpoint when the bears enter their dens with a high degree of accuracy. Of the sixty-two Yellowstone grizzly bears being tracked, forty-two entered their den for hibernation by the last day of November.
-The simulation-based p-value for this test is 0.0153. Which of the following conclusions are correct? Select all that apply.
(Multiple Choice)
4.8/5 (32)
A survey on 1,500 high school seniors who took the SAT and who completed an optional web survey shows that 55% of high school seniors are fairly certain that they will participate in a study abroad program in college. Does this survey provide convincing evidence that the majority (more than 50%) of all high school seniors who take the SAT are fairly certain they will participate in a study abroad program in college?
-State the null and alternative hypotheses in proper notation.
(Multiple Choice)
4.8/5 (31)
For each of the following scenarios, determine whether the alternative hypothesis would be one-sided or two-sided.
-According to enrollment data in 2016, 55% of undergraduates at a state university were out-of-state students. Your statistics instructor wonders if the proportion of out-of-state undergraduates at this university has changed. She surveys her students (145 students). The results of the sample showed that 73 were out-of-state students.
(Multiple Choice)
4.9/5 (43)
Filters
- Essay(0)
- Multiple Choice(0)
- Short Answer(0)
- True False(0)
- Matching(0)