Exam 10: Comparing More Than Two Means
Exam 1: Preliminaries: Introduction to Statistical Investigations46 Questions
Exam 2: Significance: How Strong Is the Evidence75 Questions
Exam 3: Generalization: How Broadly Do the Results Apply64 Questions
Exam 4: Estimation: How Large Is the Effect61 Questions
Exam 5: Causation: Can We Say What Caused the Effect30 Questions
Exam 6: Comparing Two Proportions46 Questions
Exam 7: Comparing Two Means46 Questions
Exam 8: Paired Data: One Quantitative Variable48 Questions
Exam 9: Comparing More Than Two Proportions46 Questions
Exam 10: Comparing More Than Two Means28 Questions
Exam 11: Two Quantitative Variables73 Questions
Exam 12: Modeling Randomness129 Questions
Select questions type
College students tested to see if how well you know a person affects your ability to detect a lie from that person. To do this, they came up with 10 statements about a person in their group. Five of these statements were true and five were False. The group tried to make up statements that no-body (not even close friends) would know if they were true or False. The students then presented these statements to people that fit in three groups: close friends, acquaintances, and complete strangers and counted how many statements each person correctly identified as true or False. A summary of the results are as follows. 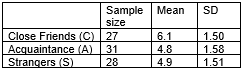 -The two graphs, A and B, show dotplots from two different data sets. Suppose I want to com-pare the means in A and do another comparison of means in B. For each case I compute an F-statistic. Which of the following will be true about these statistics?
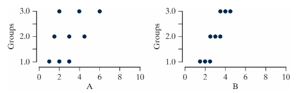
Free
(Multiple Choice)
4.9/5  (34)
(34)
Correct Answer: Verified
C
If changing the third treatment group from blue to purple increases the difference in the purple group's average score from the other two groups, all else remaining the same, what will be the impact on the strength of evidence for finding a difference in the average scores on the three exams?
Free
(Multiple Choice)
4.7/5 (36)
Correct Answer:Verified
A
In a neurological study of the effect of environment on mental development, rats were randomly assigned to be raised in one of the four following test conditions: Impoverished (wire mesh cage - housed alone), Standard (cage with other rats), Enriched (cage with other rats and toys), and Super Enriched (cage with other rats and toys changed on a periodic basis). After two months, the rats were tested on a variety of learning measures, one of them being the number of attempts needed to learn to navigate a maze. The data for the maze task are below, along with means and standard deviation for each group. 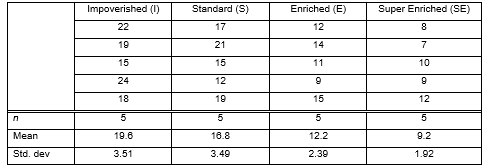 -Which of the following plots would be appropriate to investigate the relationship between test condition and number of attempts needed to learn to navigate a maze? Select all that apply.
Free
(Multiple Choice)
4.7/5 (45)
Correct Answer:Verified
C, D
In a neurological study of the effect of environment on mental development, rats were randomly assigned to be raised in one of the four following test conditions: Impoverished (wire mesh cage - housed alone), Standard (cage with other rats), Enriched (cage with other rats and toys), and Super Enriched (cage with other rats and toys changed on a periodic basis). After two months, the rats were tested on a variety of learning measures, one of them being the number of attempts needed to learn to navigate a maze. The data for the maze task are below, along with means and standard deviation for each group.
-Does the analysis using the Mean Group Diff statistic allow you to determine which test conditions differ significantly from which others?
(Multiple Choice)
4.8/5 (29)
A British study examined whether the type of background music playing in a restaurant affected the amount of money that diners spent on their meals. The researchers asked a restaurant to alternate silence, popular music, and classical music on successive nights over eighteen days. Each type of music was played for 6 nights (the order was randomly determined to guard against confounding). The type of music played and the amount spent on food and drinks (in British pounds) for each of 393 customers was recorded. The data are summarized below.
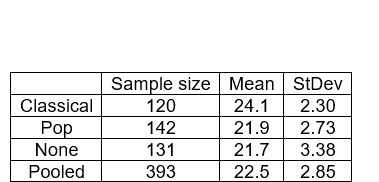
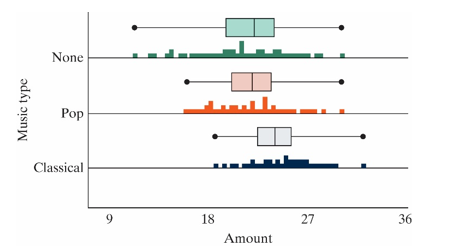 -Compute the F-statistic using the summary statistics listed.
(Short Answer)
4.9/5 (40)
A British study examined whether the type of background music playing in a restaurant affected the amount of money that diners spent on their meals. The researchers asked a restaurant to alternate silence, popular music, and classical music on successive nights over eighteen days. Each type of music was played for 6 nights (the order was randomly determined to guard against confounding). The type of music played and the amount spent on food and drinks (in British pounds) for each of 393 customers was recorded. The data are summarized below.
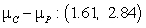
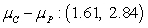
-Follow-up 95% confidence intervals are presented below.
•  •
•  •
•  The mean amount spent when classical music is playing is significantly higher than the mean amount spent when no music is playing.
(True/False)
4.8/5 (26)
College students tested to see if how well you know a person affects your ability to detect a lie from that person. To do this, they came up with 10 statements about a person in their group. Five of these statements were true and five were False. The group tried to make up statements that no-body (not even close friends) would know if they were true or False. The students then presented these statements to people that fit in three groups: close friends, acquaintances, and complete strangers and counted how many statements each person correctly identified as true or False. A summary of the results are as follows.
-Using the simulated null distribution of Mean Group Diff statistics in question 13, what is the strength of evidence against the null hypothesis?
(Multiple Choice)
4.8/5 (38)
As the size of the sample in each group increases, all else remaining the same, what will be the impact on the strength of evidence for finding a difference in the average scores on the three exams?
(Multiple Choice)
4.7/5 (33)
A British study examined whether the type of background music playing in a restaurant affected the amount of money that diners spent on their meals. The researchers asked a restaurant to alternate silence, popular music, and classical music on successive nights over eighteen days. Each type of music was played for 6 nights (the order was randomly determined to guard against confounding). The type of music played and the amount spent on food and drinks (in British pounds) for each of 393 customers was recorded. The data are summarized below.
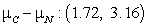
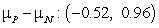
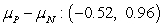
-Follow-up 95% confidence intervals are presented below.
•  •
• 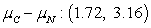 •
•  The mean amount spent when pop music is playing is significantly higher than the mean amount spent when no music is playing.
(True/False)
4.8/5 (32)
A British study examined whether the type of background music playing in a restaurant affected the amount of money that diners spent on their meals. The researchers asked a restaurant to alternate silence, popular music, and classical music on successive nights over eighteen days. Each type of music was played for 6 nights (the order was randomly determined to guard against confounding). The type of music played and the amount spent on food and drinks (in British pounds) for each of 393 customers was recorded. The data are summarized below.
-The p-value for the ANOVA F-test is less than 0.001. How would you interpret this value?
(Multiple Choice)
4.8/5 (30)
In a neurological study of the effect of environment on mental development, rats were randomly assigned to be raised in one of the four following test conditions: Impoverished (wire mesh cage - housed alone), Standard (cage with other rats), Enriched (cage with other rats and toys), and Super Enriched (cage with other rats and toys changed on a periodic basis). After two months, the rats were tested on a variety of learning measures, one of them being the number of attempts needed to learn to navigate a maze. The data for the maze task are below, along with means and standard deviation for each group.
-A simulated null distribution of 1,000 Mean Group Diff statistics follows. 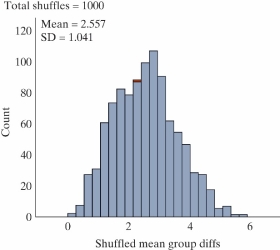 Describe how to use this distribution to calculate the p-value.
(Multiple Choice)
4.9/5 (37)
College students tested to see if how well you know a person affects your ability to detect a lie from that person. To do this, they came up with 10 statements about a person in their group. Five of these statements were true and five were False. The group tried to make up statements that no-body (not even close friends) would know if they were true or False. The students then presented these statements to people that fit in three groups: close friends, acquaintances, and complete strangers and counted how many statements each person correctly identified as true or False. A summary of the results are as follows.
-A null distribution was generated for this example and is shown. What is the shape of this distribution?
(Multiple Choice)
4.8/5 (43)
Why do you do overall tests when comparing multiple means and not just do the follow-up confidence intervals?
(Multiple Choice)
4.9/5 (38)
The two graphs, A and B, show dotplots from two different data sets. Suppose I want to com-pare the means in A and do another comparison of means in B. For each case I compute a MAD statistic. Which of the following will be true about these statistics? 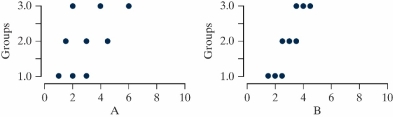
(Multiple Choice)
4.9/5 (39)
In a neurological study of the effect of environment on mental development, rats were randomly assigned to be raised in one of the four following test conditions: Impoverished (wire mesh cage - housed alone), Standard (cage with other rats), Enriched (cage with other rats and toys), and Super Enriched (cage with other rats and toys changed on a periodic basis). After two months, the rats were tested on a variety of learning measures, one of them being the number of attempts needed to learn to navigate a maze. The data for the maze task are below, along with means and standard deviation for each group.
-What is the value of the Mean Group Diff statistic?
(Short Answer)
4.9/5 (42)
College students tested to see if how well you know a person affects your ability to detect a lie from that person. To do this, they came up with 10 statements about a person in their group. Five of these statements were true and five were False. The group tried to make up statements that no-body (not even close friends) would know if they were true or False. The students then presented these statements to people that fit in three groups: close friends, acquaintances, and complete strangers and counted how many statements each person correctly identified as true or False. A summary of the results are as follows.
-If the Mean Group Diff statistic had been smaller than the observed Mean Group Diff statistic calculated in question 12, how would the strength of evidence change?
(Multiple Choice)
4.9/5 (32)
Filters
- Essay(0)
- Multiple Choice(0)
- Short Answer(0)
- True False(0)
- Matching(0)