Exam 9: Comparing More Than Two Proportions
Exam 1: Preliminaries: Introduction to Statistical Investigations46 Questions
Exam 2: Significance: How Strong Is the Evidence75 Questions
Exam 3: Generalization: How Broadly Do the Results Apply64 Questions
Exam 4: Estimation: How Large Is the Effect61 Questions
Exam 5: Causation: Can We Say What Caused the Effect30 Questions
Exam 6: Comparing Two Proportions46 Questions
Exam 7: Comparing Two Means46 Questions
Exam 8: Paired Data: One Quantitative Variable48 Questions
Exam 9: Comparing More Than Two Proportions46 Questions
Exam 10: Comparing More Than Two Means28 Questions
Exam 11: Two Quantitative Variables73 Questions
Exam 12: Modeling Randomness129 Questions
Select questions type
The Mean Group Diff statistic can never be negative.
Free
(True/False)
4.8/5  (35)
(35)
Correct Answer: Verified
True
The chi-square statistic can be negative.
Free
(True/False)
5.0/5 (43)
Correct Answer:Verified
False
As the chi-square statistic increases, we have more evidence against the null hypothesis.
Free
(True/False)
4.9/5 (41)
Correct Answer:Verified
True
Hope student researchers want to determine if students yawning (when being yawned at) is asso-ciated with the time of day (morning, afternoon, and evening). They found the following results when they yawned in front of people around campus:
• Morning: 25 of the 39 people yawned
• Afternoon: 15 of the 38 people yawned
• Evening: 29 of the 44 people yawned
-Which applet would you use to conduct a theory-based test of association between time of day and whether a person yawns?
(Multiple Choice)
4.8/5 (44)
Hope student researchers want to determine if students yawning (when being yawned at) is asso-ciated with the time of day (morning, afternoon, and evening). They found the following results when they yawned in front of people around campus:
• Morning: 25 of the 39 people yawned
• Afternoon: 15 of the 38 people yawned
• Evening: 29 of the 44 people yawned
-Are validity conditions met to conduct a chi-square test of association?
(Multiple Choice)
4.7/5 (32)
Are people equally likely to be born on any day of the seven days of the week? Or are some days more likely to be a person's birthday than other days? To investigate this question, days of birth were recorded for the 147 "noted writers of the present" listed in The World Almanac and Book of Facts 2000. The counts for the seven days of the week are given in the following table.  -Are validity conditions met to conduct a theory-based chi-square goodness-of-fit test?
(Multiple Choice)
4.8/5 (43)
Researchers analyzed eating behavior and obesity at Chinese buffets. They estimated people's body mass indexes (BMI) as they entered the restaurant then categorized them into three groups---bottom third (lightest), middle third, and top third (heaviest). One variable they looked at was whether or not they browsed the buffet (looked it over) before serving themselves or served themselves immediately. Treating the BMI categories as the explanatory variable and whether or not they browsed first as the response, the researchers wanted to see if there was an association between BMI and whether or not they browsed the buffet before serving themselves. They found the following results:
• Bottom Third: 35 of the 50 people browsed first
• Middle Third: 24 of the 50 people browsed first
• Top Third: 17 of the 50 people browsed first
-Based upon the p-value of 0.001, what is the appropriate conclusion for this test?
(Multiple Choice)
4.9/5 (33)
According to the 2019 U.S. Census Bureau estimates, 63.4% of the U.S. self-identifies as Non-Hispanic white, 15.3% as Hispanic and Latino, 13.4% as Black or African American, 5.9% as Asian, and 2.0% as Other. A random sample of 1000 students graduating from California colleges and universities resulted in the following data on self-identified race: 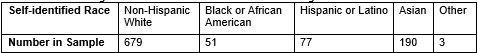 You would like to determine if the distribution of self-identified race among California college and university students differs from the distribution of self-identified race in the U.S. overall.
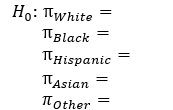
-What is the null hypothesis? Fill in the value for each parameter.
You would like to determine if the distribution of self-identified race among California college and university students differs from the distribution of self-identified race in the U.S. overall.
-What is the null hypothesis? Fill in the value for each parameter.
(Essay)
4.8/5 (31)
The Mean Group Diff statistic is the average of a group of sample proportions.
(True/False)
4.8/5 (36)
Hope student researchers want to determine if students yawning (when being yawned at) is asso-ciated with the time of day (morning, afternoon, and evening). They found the following results when they yawned in front of people around campus:
• Morning: 25 of the 39 people yawned
• Afternoon: 15 of the 38 people yawned
• Evening: 29 of the 44 people yawned
-When this test is run, a p-value of 0.03 is found. What would be an appropriate conclusion?
(Multiple Choice)
4.9/5 (43)
Can telling a joke affect whether or not a customer in a coffee bar leaves a tip for the waiter? A study investigated this question at a coffee bar in France. The waiter randomly assigned coffee-ordering customers into three groups: one received a card telling a joke with their bill, another group received a card containing an advertisement for a local restaurant, and the third received no card. The results are shown below. 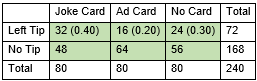 -Use the Multiple Proportions applet to calculate the follow-up 95% confidence intervals for difference in proportions. Based on the output, which of the following statements are correct? Select all that apply.
(Multiple Choice)
4.8/5 (30)
Is there an association between a person's political affiliation (Democrat, Republican, or Inde-pendent) and whether or not they give to charity?
-Assume that, in reality, there is no association between a person's political affiliation and whether or not they give to charity. Which of the following has the largest probability?
(Multiple Choice)
4.9/5 (32)
The chi-square statistic is the ratio of variability between the groups and the variability within the groups.
(True/False)
4.7/5 (38)
Can telling a joke affect whether or not a customer in a coffee bar leaves a tip for the waiter? A study investigated this question at a coffee bar in France. The waiter randomly assigned coffee-ordering customers into three groups: one received a card telling a joke with their bill, another group received a card containing an advertisement for a local restaurant, and the third received no card. The results are shown below.
-Are validity conditions met to conduct a chi-square test of association?
(Multiple Choice)
4.8/5 (29)
Which of the following is not one of the 3 "S"'s in the 3S strategy?
(Multiple Choice)
4.8/5 (35)
According to the 2019 U.S. Census Bureau estimates, 63.4% of the U.S. self-identifies as Non-Hispanic white, 15.3% as Hispanic and Latino, 13.4% as Black or African American, 5.9% as Asian, and 2.0% as Other. A random sample of 1000 students graduating from California colleges and universities resulted in the following data on self-identified race: You would like to determine if the distribution of self-identified race among California college and university students differs from the distribution of self-identified race in the U.S. overall.
-In the null hypothesis, what does the symbol ?_Race represent?
(Multiple Choice)
4.9/5 (30)
According to the 2019 U.S. Census Bureau estimates, 63.4% of the U.S. self-identifies as Non-Hispanic white, 15.3% as Hispanic and Latino, 13.4% as Black or African American, 5.9% as Asian, and 2.0% as Other. A random sample of 1000 students graduating from California colleges and universities resulted in the following data on self-identified race: You would like to determine if the distribution of self-identified race among California college and university students differs from the distribution of self-identified race in the U.S. overall.
-Use the
Goodness of Fit applet to conduct a simulation-based chi-square goodness-of-fit test using the MAD (mean absolute difference) statistic, and report the statistic and the p-value. Use at least 1000 shuffles.
MAD statistic =
p-value =
(Short Answer)
4.8/5 (29)
According to the 2019 U.S. Census Bureau estimates, 63.4% of the U.S. self-identifies as Non-Hispanic white, 15.3% as Hispanic and Latino, 13.4% as Black or African American, 5.9% as Asian, and 2.0% as Other. A random sample of 1000 students graduating from California colleges and universities resulted in the following data on self-identified race: You would like to determine if the distribution of self-identified race among California college and university students differs from the distribution of self-identified race in the U.S. overall.
-Based upon a p-value of less than 0.001, what is an appropriate conclusion for the goodness-of-fit test?
(Multiple Choice)
4.8/5 (40)
The Mean Group Diff statistic is the average distance sample proportions are from each other.
(True/False)
4.8/5 (31)
Can telling a joke affect whether or not a customer in a coffee bar leaves a tip for the waiter? A study investigated this question at a coffee bar in France. The waiter randomly assigned coffee-ordering customers into three groups: one received a card telling a joke with their bill, another group received a card containing an advertisement for a local restaurant, and the third received no card. The results are shown below.
-Use the Multiple Proportions applet to calculate the chi-square statistic and theory-based p-value for these data.
Chi-square statistic =
p-value =
(Short Answer)
4.8/5 (30)
Filters
- Essay(0)
- Multiple Choice(0)
- Short Answer(0)
- True False(0)
- Matching(0)