Exam 10: Analysis of Quantitative Data
Exam 1: Doing Social Research26 Questions
Exam 2: Theory and Social Research35 Questions
Exam 3: Ethics in Social Research21 Questions
Exam 4: Reviewing the Scholarly Literature and Planning a Study31 Questions
Exam 5: Qualitative and Quantitative Measurement43 Questions
Exam 6: Qualitative and Quantitative Sampling45 Questions
Exam 7: Survey Research32 Questions
Exam 8: Experimental Research53 Questions
Exam 9: Nonreactive Research and Secondary Analysis23 Questions
Exam 10: Analysis of Quantitative Data60 Questions
Exam 11: Field Research and Focus Group Research33 Questions
Exam 12: Historical-Comparative Research23 Questions
Exam 13: Analysis of Qualitative Data14 Questions
Exam 14: Writing the Research Report15 Questions
Select questions type
Ten college students, five males and five females, took a test on geography knowledge with 20 questions. The number correct is listed below.
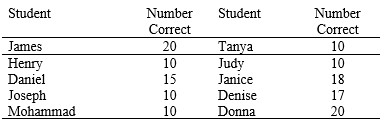 Which of the following is TRUE, if any?
(Multiple Choice)
4.9/5  (42)
(42)
Given the following 6 men's shoe sizes:
9, 10, 10, 8, 12, 11
-The MODE is
(Multiple Choice)
4.7/5 (37)
Why is knowing the variability or dispersion of a variable as important as knowing its central tendency?
(Essay)
4.9/5 (42)
Given the following 6 men's shoe sizes:
9, 10, 10, 8, 12, 11
-The MEAN is
(Multiple Choice)
4.7/5 (31)
Refer to the information provided in Table 10.3 below to answer the questions that follow.
Table 10.3:
Annual Family Income and Education*
Statistics for Three Neighborhoods
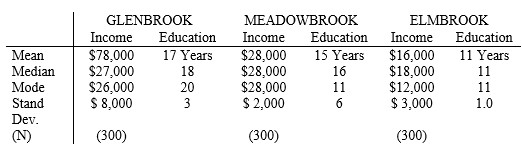 * 4 yrs college = 16 yrs; masters/law degrees = 18 yrs; PhD/MD degrees = 20 yrs.
-Which neighborhood(s) has a skewed income distribution?
* 4 yrs college = 16 yrs; masters/law degrees = 18 yrs; PhD/MD degrees = 20 yrs.
-Which neighborhood(s) has a skewed income distribution?
(Multiple Choice)
4.9/5 (34)
Professor Hogshead found a statistically significant relationship between variable X and variable Y. It is statistically significant at the .05 level. What does this mean?
(Multiple Choice)
4.8/5 (35)
Explain how a researcher uses a codebook in quantitative research and two ways to "clean"
the quantitative data prior to analysis.
(Essay)
4.8/5 (44)
What are the differences between the mean , median , and mode ? How are they affected by a normal versus a skewed distribution of data?
(Essay)
4.9/5 (35)
Describe three ways a researcher can display information on one variable.
(Essay)
4.7/5 (35)
Given the following 6 men's shoe sizes:
9, 10, 10, 8, 12, 11
-The MEDIAN is
(Multiple Choice)
4.8/5 (41)
What features of a bivariate relationship can be seen from a scattergram?
(Short Answer)
4.9/5 (32)
Filters
- Essay(0)
- Multiple Choice(0)
- Short Answer(0)
- True False(0)
- Matching(0)