Exam 4: Sellers and Incentives,aggregate Incomes
Exam 1: Economic Methods and Optimization: Doing the Best You Can6 Questions
Exam 2: Demand, Supply, and Equilibrium7 Questions
Exam 3: Consumers and Incentives,the Wealth of Nations: Defining and Measuring Macroeconomic Aggregates45 Questions
Exam 4: Sellers and Incentives,aggregate Incomes29 Questions
Exam 5: Perfect Competition and the Invisible Hand, Economic Growth20 Questions
Exam 6: Trade and Why Isnt the Whole World Developed16 Questions
Exam 7: Externalities and Public Goods, Employment and Unemployment12 Questions
Exam 8: The Government in the Economy: Taxation and Regulation, Credit Markets25 Questions
Exam 9: Markets for Factors of Production and the Monetary System21 Questions
Exam 10: Monopoly and Short-Run Fluctuations13 Questions
Exam 11: Game Theory and Strategic Play8 Questions
Exam 12: Oligopoly and Monopolistic Competition15 Questions
Exam 13: Trade-Offs Involving Time and Risk and Open Economy Macroeconomics28 Questions
Exam 14: Social Economics and Auctions and Bargaining13 Questions
Exam 15: Web: Financial Decision Making31 Questions
Exam 16: Web: Economics of Life, Health, and the Environment68 Questions
Exam 17: Web: Political Economy76 Questions
Select questions type
In The Wealth of Nations, Adam Smith argued that "the division of labor [specialization] was limited by the extent of the market."(Bracketed remark added.) Which of the following best explains Smith's argument?
Free
(Multiple Choice)
4.7/5  (40)
(40)
Correct Answer: Verified
A
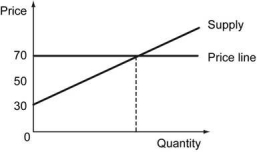
Define producer surplus. Calculate the producer surplus from the following figure.
Free
(Essay)
4.9/5 (32)
Correct Answer:Verified
Producer surplus is the area between the supply curve and the equilibrium price of a good. It represents a useful tool for measuring the net benefits that sellers receive from participating in a market. In the figure, producer surplus = (1/2) × (70 - 30) × 50 = (1/2) × 40 × 50 = $1,000.
The figure below shows the marginal cost (circles) and the average variable cost (crosses) of a firm in a competitive market. The firm always makes the choice to maximize its profit.
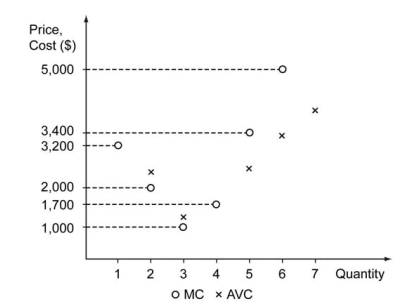 -Refer to the figure above. If the market price of the product is $5,000, what is the firm's producer surplus?
Free
(Multiple Choice)
4.9/5 (41)
Correct Answer:Verified
C
Berylia?s aggregate production function is Y = A K1/3 H2/3. What is the contribution of technology to Berylia?s GDP if its GDP is $2,000,000, the physical capital stock is 125,000 units, and the total efficiency units of labor is 1,000,000?
(Essay)
4.8/5 (42)
If the aggregate income of an island country is $8 million and income per capita is $5,000, the total population of the island is ________.
(Multiple Choice)
4.8/5 (34)
The following table shows economic data for two countries.
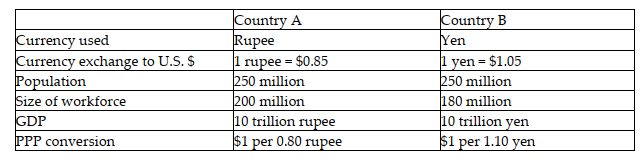 -Refer to the table above. Income per worker in Country B is equal to ________.
(Multiple Choice)
4.7/5 (49)
If the income per capita in United Kingdom is £23,800 and the dollar per pound exchange rate is 1.68 in 2014, then income per capita in the United Kingdom in U.S. dollars in the same year is ________.
(Multiple Choice)
4.8/5 (25)
Suppose the market for AR-15 style rifles in the United States was in an initial long-run equilibrium. In the fall of 2012, the demand for these rifles increased substantially due to concerns that President Obama would either ban or restrict the sale of these semi-automatic rifles. As a result, the market price of these rifles increased, and gun manufacturers earned positive economic profits (shown in the figure below). 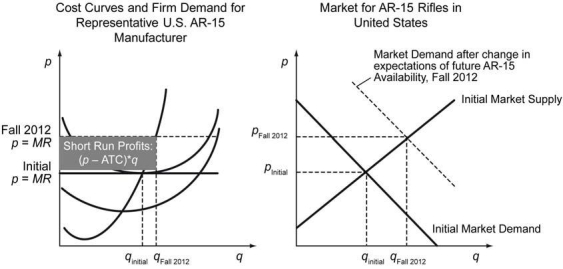 The presence of economic profits in the short-run will lead to the ________.
(Multiple Choice)
4.9/5 (37)
The following figure shows the cost curves on a firm that operates in a competitive market. Assume that all the firms in this market have identical cost structure.
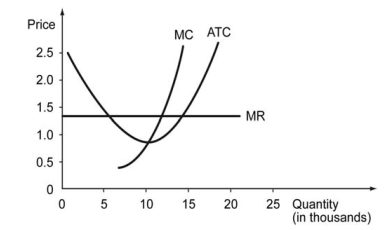 -Refer to the graph above. Which of the following graphs, correctly represents this competitive marke's demand and supply in the long run?
(Multiple Choice)
4.9/5 (41)
Two countries, Baltonia and Polonia, have aggregate production functions in the form Y = A × K1/3 × H2/3, where Y denotes total output, A denotes the level of technology, K denotes the physical capital stock, and H denotes the number of efficiency units of production. Both countries have the same number of efficiency units of labor and use the same technology. However, Baltonia has a smaller physical capital stock than Polonia does. Which of the following is likely to be true in this case?
(Multiple Choice)
4.8/5 (30)
The income per capita in a country with a population of 50,000 is $4,500. Its GDP is ________.
(Multiple Choice)
4.9/5 (44)
Two economies, A and B, have identical aggregate production functions with diminishing returns. In both economies, capital and labor are equally important for production. Economy A has twice as many efficiency units of labor as economy B. Economy B has twice as much physical capital stock as economy A.
-Refer to the scenario above. If you were to draw the aggregate production functions for economies A and B, holding physical capital stock constant at each county's given level, you would draw ________.
(Multiple Choice)
4.9/5 (46)
A car repair shop hires workers and pays them the federal minimum wage of $7.25. The following table shows the marginal returns to each worker in terms of number of cars repaired.
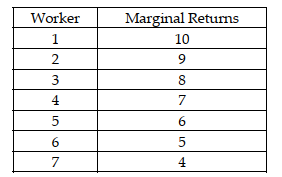 -Refer to the scenario above. In addition, suppose the fixed cost of operating this shop is $1,000 per day. If 3 workers are hired at the federal minimum wage of $7.25, what is the total cost of this shop?
(Multiple Choice)
4.8/5 (36)
The price of a standard basket of goods in Country A is 10 pesos. The price of the same basket of goods in country B is 25 francs and $5 in the United States. Country A has an income per capita of 60,000 pesos, and country B has an income per capita of 100,000 francs. Assume full employment in both countries.
-Refer to the scenario above. The difference between the GDP per capita in Country A and country B is________.
(Multiple Choice)
4.8/5 (46)
Country X has 1,000 workers. The countryʹs aggregate production function is YX = 1.5 KX2/3 HX1/3, where KX = 1,000,000 and HX = 2,500,000.
-Refer to the scenario above. What was the country's GDP per capita?
(Multiple Choice)
4.9/5 (42)
The figure below shows the cost curves of a firm in a competitive market. The firm always makes the choice to maximize its profit.
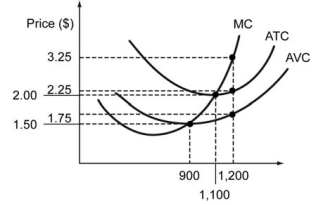 -Refer to the figure above. If the market price of the product is $3.25, the firm's profit maximizing output is ________ and the firm's maximum profit is ________.
(Multiple Choice)
5.0/5 (36)
The following figure shows the cost curves on a firm that operates in a competitive market. Assume that all the firms in this market have identical cost structure.
-Refer to the graph above. Which of the following graphs correctly represents this competitive market's demand and supply in the short run?
(Multiple Choice)
4.9/5 (28)
The figure below shows the marginal cost (circles) and the average variable cost (crosses) of a firm in a competitive market. The firm always makes the choice to maximize its profit.
-Refer to the figure above. If the market price of the product fell from $5,000 to $3,400, what is the loss of the firm's producer surplus?
(Multiple Choice)
4.9/5 (40)
In Lutheria, there are 10,000 people in the age group of 0-14 years, 30,000 people are employed, and 2,000 people are unemployed. Lutheria?s GDP, measured in luthers, is 1 billion. Income per worker in Lutheria is ________ luthers.
(Multiple Choice)
4.9/5 (39)
Filters
- Essay(0)
- Multiple Choice(0)
- Short Answer(0)
- True False(0)
- Matching(0)