Exam 9: Graphs of Linear Equations
Exam 1: Whole Numbers394 Questions
Exam 2: Fraction Notation352 Questions
Exam 3: Decimal Notation457 Questions
Exam 4: Percent Notation436 Questions
Exam 5: Data, Graphs, and Statistics157 Questions
Exam 6: Geometry317 Questions
Exam 7: Introduction to Real Numbers and Algebraic Expressions354 Questions
Exam 8: Solving Equations and Inequalities272 Questions
Exam 9: Graphs of Linear Equations190 Questions
Exam 10: Polynomials: Operations389 Questions
Exam 11: Polynomials: Factoring192 Questions
Exam 12: Rational Expressions and Equations199 Questions
Exam 13: Systems of Equations79 Questions
Exam 14: Radical Expressions and Equations149 Questions
Exam 15: Quadratic Equations185 Questions
Exam 16: Converting Units of Measurement459 Questions
Select questions type
Graph the line containing the given pair of points and find the slope.
-
(Multiple Choice)
4.8/5  (28)
(28)
Determine whether the graphs of the equations are parallel lines, perpendicular lines, or neither.
-
(Multiple Choice)
4.7/5 (32)
Solve the problem.
-The following graph shows data for a recent train ride from New York to Toronto. Find the rate of change of the distance from New York with respect to time, in miles per hour. 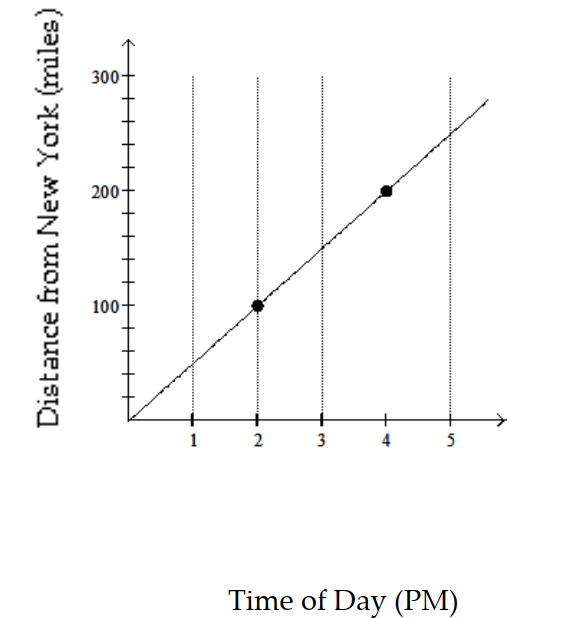
(Multiple Choice)
4.8/5 (31)
Show that the two ordered pairs are solutions to the given equation. Then use the graph of the two points to determine another solution. Answers may vary.
-

(Essay)
5.0/5 (34)
Show that the two ordered pairs are solutions to the given equation. Then use the graph of the two points to determine another solution. Answers may vary.
-

(Essay)
4.9/5 (40)
Find the slope of the line going through the pair of points.
-
(Multiple Choice)
4.9/5 (41)
Find the - and -intercepts for the equation. Then graph the equation.
- 
(Multiple Choice)
4.8/5 (41)
Choose the ordered pair which is a solution of the inequality.
-
(Multiple Choice)
4.7/5 (38)
Solve the problem.
-Suppose the sales of a particular brand of appliance satisfy the relationship , where represents the number of sales in year , with corresponding to 1982 . Find the number of sales in 1997.
(Multiple Choice)
4.8/5 (37)
Solve the problem.
-The value of a particular computer system is represented in the following graph. Find the rate of change of the value of the computer system with respect to time, in dollars per year.
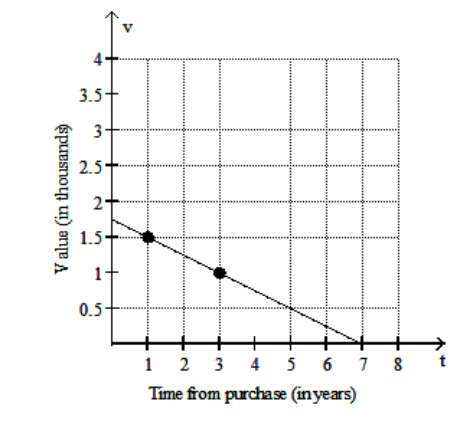
(Multiple Choice)
4.9/5 (30)
Determine whether the given ordered pair is a solution of the equation.
-
(True/False)
4.8/5 (29)
Show that the two ordered pairs are solutions to the given equation. Then use the graph of the two points to determine another solution. Answers may vary.
-
(Essay)
4.8/5 (30)
Determine whether the graphs of the equations are parallel lines, perpendicular lines, or neither.
-
(Multiple Choice)
4.7/5 (41)
Filters
- Essay(0)
- Multiple Choice(0)
- Short Answer(0)
- True False(0)
- Matching(0)