Exam 4: Basic Estimation Techniques
Exam 1: Managers, Profits, and Markets25 Questions
Exam 2: Demand, Supply, and Market Equilibrium52 Questions
Exam 3: Marginal Analysis for Optimal Decision Making25 Questions
Exam 4: Basic Estimation Techniques50 Questions
Exam 5: Theory of Consumer Behavior52 Questions
Exam 6: Elasticity and Demand47 Questions
Exam 7: Demand Estimation and Forecasting66 Questions
Exam 8: Production and Cost in the Short Run33 Questions
Exam 9: Production and Cost in the Long Run52 Questions
Exam 10: Production and Cost Estimation53 Questions
Exam 11: Managerial Decisions in Competitive Markets58 Questions
Exam 12: Managerial Decisions for Firms With Market Power68 Questions
Exam 13: Strategic Decision Making in Oligopoly Markets54 Questions
Exam 14: Advanced Techniques for Profit Maximization67 Questions
Exam 15: Decisions Under Risk and Uncertainty35 Questions
Exam 16: Government Regulation of Business29 Questions
Select questions type
4-4F Suppose Y is related to R and S in the following nonlinear way:
 Twenty-six observations are used to obtain the following regression results:
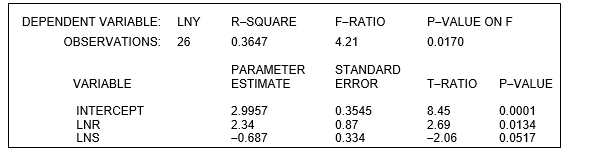
-At the 1% level of significance, the critical value of the F-statistic is _________. The model as a whole _________ (is, is not) significant at the 1% level.
-At the 1% level of significance, the critical value of the F-statistic is _________. The model as a whole _________ (is, is not) significant at the 1% level.
(Short Answer)
4.8/5  (34)
(34)
A simple linear regression equation relates G and D as follows:
G = a + bD
-The explanatory variable is _______, and the dependent variable is ________.
(Short Answer)
4.9/5 (23)
refer to the following computer output from estimating the parameters of the nonlinear model
 The computer output from the regression analysis is:
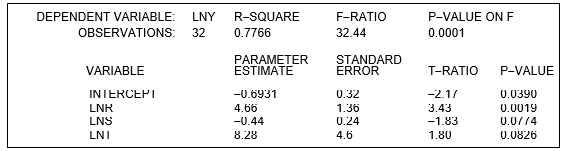 -The nonlinear relation can be transformed into the following linear regression model:
(Multiple Choice)
4.8/5 (42)
refer to the following:
A firm is experiencing theft problems at its warehouse. A consultant to the firm believes that the dollar loss from theft each week (T) depends on the number of security guards (G) and on the unemployment rate in the county where the warehouse is located (U measured as a percent). In order to test this hypothesis, the consultant estimated the regression equation T = a + bG + cU and obtained the following results:
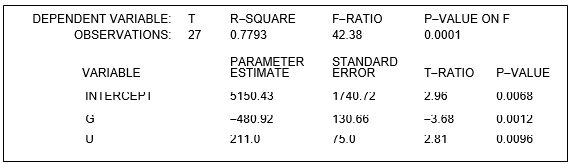 -Which of the following is correct at the 1% level of significance?
(Multiple Choice)
4.8/5 (28)
In a multiple regression model, the coefficients on the independent variables measure
(Multiple Choice)
4.9/5 (27)
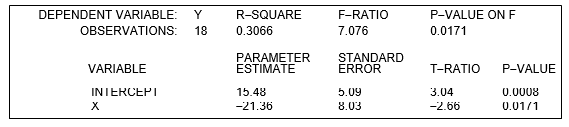
Thirty-two data points on Y and X are employed to estimate the parameters in the linear relation Y = a + bX. The computer output from the regression analysis is
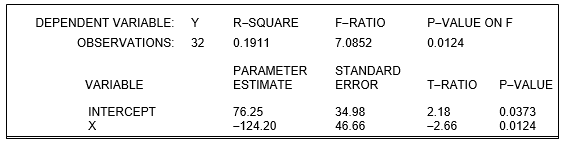 -The p-value for indicates that the exact level of significance is ______ percent, which is the probability of _________________________________________.
(Short Answer)
4.8/5 (37)
refer to the following:
The linear regression equation, Y = a + bX, was estimated. The following computer printout was
obtained:
 -What is the critical value of t at the 1% level of significance?
(Multiple Choice)
4.9/5 (34)
A simple linear regression equation relates G and D as follows:
G = a + bD
-For each one-unit increase in D, the change in R is ______ units.
(Short Answer)
4.8/5 (34)
refer to the following nonlinear model which relates W to P, Q, and R:
 The computer output form the regression analysis is:
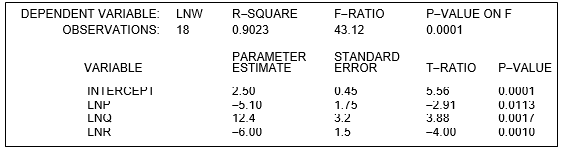 -The nonlinear relation can be transformed into the following linear regression model:
(Multiple Choice)
5.0/5 (37)
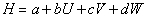
4-5F Seventy-five data point on H, U, V, and W are employed to estimate the parameters in the linear relation
 . The computer output from the regression analysis is shown below:
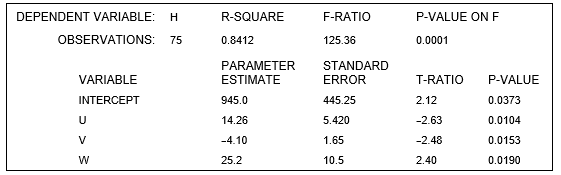 -At the 2% level of significance,
  _________ (is, is NOT) significant,
  _________ (is, is NOT) significant,
  _________ (is, is NOT) significant, and
  _________ (is, is NOT) significant.
(Short Answer)
4.8/5 (33)
Filters
- Essay(0)
- Multiple Choice(0)
- Short Answer(0)
- True False(0)
- Matching(0)