Exam 9: Production and Cost in the Long Run
Exam 1: Managers, Profits, and Markets25 Questions
Exam 2: Demand, Supply, and Market Equilibrium52 Questions
Exam 3: Marginal Analysis for Optimal Decision Making25 Questions
Exam 4: Basic Estimation Techniques50 Questions
Exam 5: Theory of Consumer Behavior52 Questions
Exam 6: Elasticity and Demand47 Questions
Exam 7: Demand Estimation and Forecasting66 Questions
Exam 8: Production and Cost in the Short Run33 Questions
Exam 9: Production and Cost in the Long Run52 Questions
Exam 10: Production and Cost Estimation53 Questions
Exam 11: Managerial Decisions in Competitive Markets58 Questions
Exam 12: Managerial Decisions for Firms With Market Power68 Questions
Exam 13: Strategic Decision Making in Oligopoly Markets54 Questions
Exam 14: Advanced Techniques for Profit Maximization67 Questions
Exam 15: Decisions Under Risk and Uncertainty35 Questions
Exam 16: Government Regulation of Business29 Questions
Select questions type
The following graph shows 2 isocost curves for a firm. The price of capital is $200.
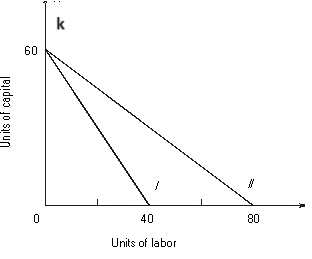 -The equation for isocost I is _____________________. With isocost I the firm must give up ______ units of capital to purchase one more unit of labor in the market.
Free
(Short Answer)
4.8/5  (45)
(45)
Correct Answer: Verified
K = 60 - 1.5L; 1.5
refer to the following:
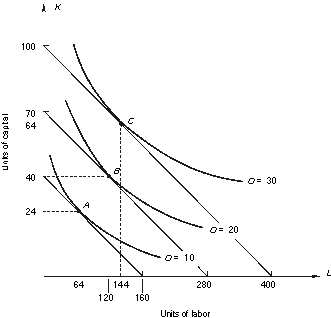 The price of capital is $100 per unit; the price of labor is $25 per unit.
-When output is 30 units, what is TOTAL cost?
The price of capital is $100 per unit; the price of labor is $25 per unit.
-When output is 30 units, what is TOTAL cost?
Free
(Multiple Choice)
4.9/5 (39)
Correct Answer:Verified
C
Use the following figure that shows a firm's isoquant for producing 3,000 units of output and four isocost curves. Labor and capital each cost $100 per unit. 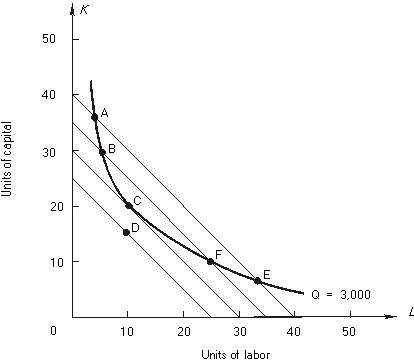 -At point A, the MRTS is ____________ (less than, greater than, equal to) the input price ratio, w/r. The total cost of producing 3,000 units of output with input combination A is $____________.
Free
(Short Answer)
4.8/5 (31)
Correct Answer:Verified
greater than; $4,000
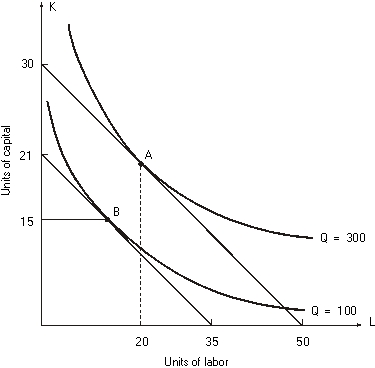
In the following figure, isoquant I is one of a firm's isoquants:
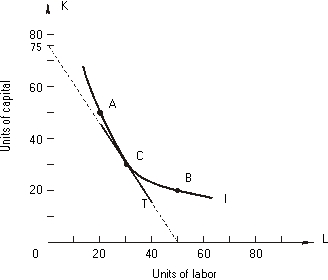 -The marginal rate of technical substitution at point C is _________.
(Short Answer)
4.9/5 (37)
The following graph shows 2 isocost curves for a firm. The price of capital is $200.
-The total cost associated with isocost II is $_________, and the price of labor is $_________.
(Short Answer)
4.7/5 (37)
The following graph shows a firm's long-run average and marginal cost curves.
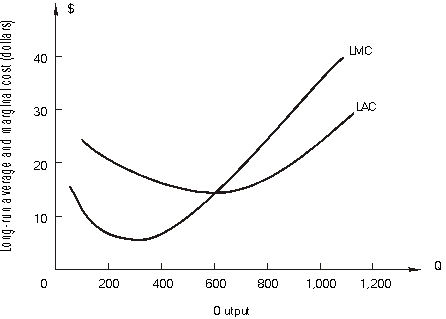 -At 900 units of output ATC = $_________ and MC = $_________.
(Short Answer)
4.8/5 (40)
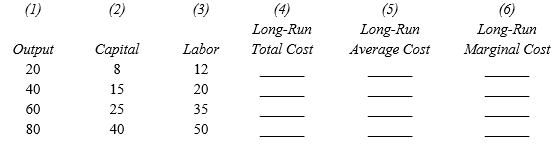
Using the above table, answer the following questions.
-Diseconomies of scale exist beyond ______ units of output because _________ is _________.
(Short Answer)
4.7/5 (42)
A firm is using 20 units of labor and 30 units of capital to produce 4,000 units of output. At this combination the marginal product of labor is 50 and the marginal product of capital is 40. The price of labor is $30 and the price of capital is $20.
-The MP per dollar of labor is _________ and the MP per dollar of capital is _________.
(Short Answer)
4.7/5 (42)
refer to the following figure:
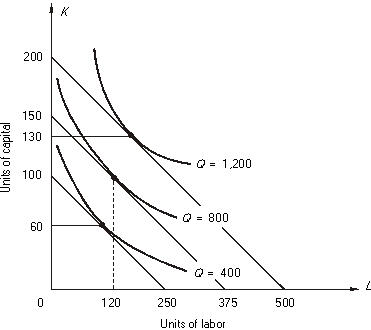 The price of capital is $50 per unit.
-What is the minimum cost of producing 1,200 units of output?
The price of capital is $50 per unit.
-What is the minimum cost of producing 1,200 units of output?
(Multiple Choice)
4.7/5 (34)
The following graph shows 2 isocost curves for a firm. The price of capital is $200.
-The total cost associated with isocost I is $_________, and the price of labor is $_________.
(Short Answer)
4.8/5 (44)
refer to the following figure:
The price of capital is $50 per unit.
-What is the minimum cost of producing 400 units of output?
(Multiple Choice)
4.7/5 (47)
Answer the following:
-The movement from E to F reduces the MP per dollar spent on ____________ and increases the MP per dollar spent on ____________. This movement __________________ (increased, decreased) total cost by $____________.
(Short Answer)
4.9/5 (34)
Use the following figure that shows a firm's isoquant for producing 3,000 units of output and four isocost curves. Labor and capital each cost $100 per unit.
-By moving from A to B, the firm _______________ (increases, decreases) labor usage and _______________ (increases, decreases) capital usage. At point B the MRTS is _______________ (greater than, less than, equal to) the input price ratio, w/r. The movement from A to B _______________ (increased, decreased) total cost by $_________.
(Short Answer)
4.9/5 (45)
refer to the following figure:
The price of capital is $50 per unit.
-The minimum cost of producing 800 units of output is
(Multiple Choice)
4.7/5 (28)
Answer the following:
-At point E, the MP per dollar spent on ____________ is less than the MP per dollar spent on ____________. The total cost of producing 3,000 units of output with input combination E is $_________.
(Short Answer)
4.8/5 (27)
Using the above table, answer the following questions.
-At 60 units of output LTC = $_________ and LAC = $_________. Between 40 and 60 units LMC = $_________.
(Short Answer)
4.7/5 (41)
Answer the following:
-At input combination C the MP per dollar spent on labor is __________________ (greater than, less than, equal to) the MP per dollar spent on capital.
(Short Answer)
4.9/5 (35)
refer to the following:
 The price of labor is $3 per unit.
-What is the price per unit of capital?
The price of labor is $3 per unit.
-What is the price per unit of capital?
(Multiple Choice)
4.8/5 (44)
Using the above table, answer the following questions.
refer to the following table in which columns, 1, 2, and 3 are derived from a firm's long-run expansion path. The price of capital is $50 and the price of labor is $30.
 Using the above table, answer the following questions.
-At 40 units of output LTC = $______ and LAC = $______. Between 20 and 40 units LMC = $______.
Using the above table, answer the following questions.
-At 40 units of output LTC = $______ and LAC = $______. Between 20 and 40 units LMC = $______.
(Short Answer)
4.8/5 (33)
A firm increases its usage of all inputs by 20%.
-If output increases by less than 20%, the firm is in a range of ______________________.
(Short Answer)
5.0/5 (33)
Filters
- Essay(0)
- Multiple Choice(0)
- Short Answer(0)
- True False(0)
- Matching(0)