Exam 26: Introduction to Statistics and Probability
Exam 1: Numerical Computation129 Questions
Exam 2: Introduction to Algebra130 Questions
Exam 3: Simple Equations and Word Problems83 Questions
Exam 4: Functions85 Questions
Exam 5: Graphs64 Questions
Exam 6: Geometry103 Questions
Exam 7: Right Triangles and Vectors88 Questions
Exam 8: Factors and Factoring136 Questions
Exam 9: Fractions and Fractional Equations155 Questions
Exam 10: Systems of Linear Equations75 Questions
Exam 11: Determinants75 Questions
Exam 12: Matrices96 Questions
Exam 13: Exponents and Radicals125 Questions
Exam 14: Quadratic Equations151 Questions
Exam 15: Oblique Triangles and Vectors89 Questions
Exam 16: Radian Measure, Arc Length, and Circular Motion75 Questions
Exam 17: Graphs of the Trigonometric Functions70 Questions
Exam 18: Trigonometric Identities and Equations116 Questions
Exam 19: Ratio, Proportion, and Variation98 Questions
Exam 20: Exponential and Logarithmic Functions140 Questions
Exam 21: Complex Numbers115 Questions
Exam 22: Analytic Geometry129 Questions
Exam 23: Binary, Hexadecimal, Octal, and Bcd Numbers110 Questions
Exam 24: Inequalities and Linear Programming39 Questions
Exam 25: Sequences, Series, and the Binomial Theorem121 Questions
Exam 26: Introduction to Statistics and Probability68 Questions
Exam 27: Derivatives of Algebraic Functions83 Questions
Exam 28: Graphical Applications of the Derivative50 Questions
Exam 29: Applied Applications of the Derivative71 Questions
Exam 30: Integration69 Questions
Exam 31: Applications of the Integral50 Questions
Exam 32: More Applications of the Integral58 Questions
Exam 33: Derivatives of Trigonometric, Logarithmic, and Exponential Functions113 Questions
Exam 34: Methods of Integration89 Questions
Exam 35: Differential Equations103 Questions
Exam 36: Solving Differential Equations by the Laplace Transform and by Numerical Methods56 Questions
Exam 37: Infinite Series60 Questions
Select questions type
Company sold 127 computers in the year 1990. The number of computers sold by each of its five sales representatives in 1990 is shown in the table below:
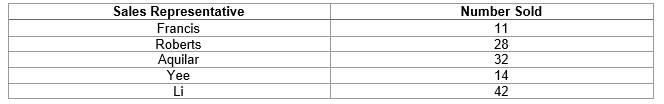 (a) Make a bar chart for the data.
(b) Make a pie chart for the data.
(a) Make a bar chart for the data.
(b) Make a pie chart for the data.
(Essay)
4.8/5  (41)
(41)
We draw a ball from a bag that contains 4 red balls and 11 white balls. We replace the ball and draw another ball. What is the probability that both balls are white balls?
(Short Answer)
4.8/5 (37)
A snack company states that the weight of their chip bags is normally distributed with a mean of and standard deviation of . What is the probability of a randomly selected chip bag having a weight less than ?
(Short Answer)
4.9/5 (45)
The time (in minutes) taken to commute to work for 24 random people is given below:
5 7 8 8 10 10 12 15 15 15 18 20 20 20 20 22 24 24 25 25 25 26 27 28
Construct a frequency distribution for the data (include class, frequency, and cumulative relative frequency).
(Essay)
4.8/5 (28)
The amount of honey in a bee hive was recoded over several days
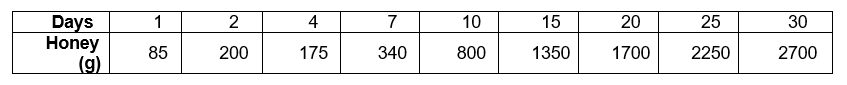 Find the correlation coefficient and the least squares line.
(Short Answer)
4.8/5 (35)
The amount of hours spent on the computer per week for a sample of 40 random people is given below:
3 3 5 5 7 7 7 8 10 10 10 12 12 13 14 14 14 14 15 15 15 15 15 16 17 18 18 18 20 21 21 21 21 21 22 23 25 25 25 28
(a) Construct a frequency distribution for the data (include class, frequency, and cumulative relative frequency).
(b) Draw a histogram for the distribution.
(Essay)
4.7/5 (28)
A bag contains five yellow jelly beans, six red jelly beans and eight blue jelly beans. If a jelly bean is drawn at random from the bag, what is the probability that it will be red?
(Short Answer)
4.8/5 (40)
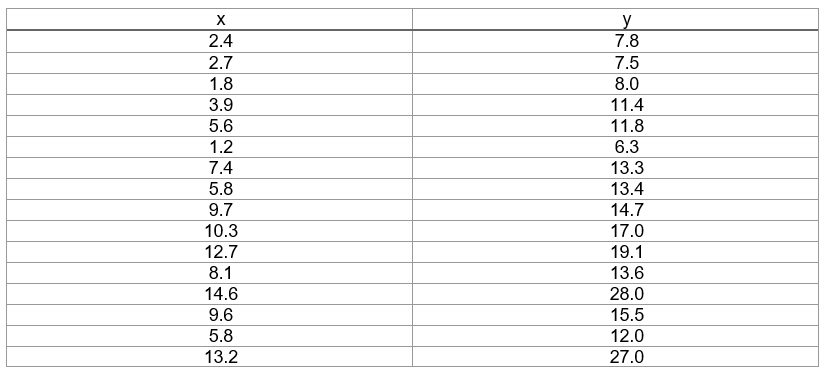
Given the following data:
 Find the correlation coefficient and the least squares line.
(Short Answer)
4.8/5 (38)
A box contains twelve fuses and eight fuses. What is the probability of selecting a amp fuse at random?
(Short Answer)
4.8/5 (37)
A certain coffee company has a prize promotion involving peeling a sticker from the top of your cup. If one in eight cups is a winner, what is the probability of winning 4 times if you buy 20 coffees? Express your answer to four decimal places.
(Short Answer)
4.8/5 (35)
In a certain parking lot, of the cars have four doors, of the cars are blue, and of the cars have four doors and are blue. What is the probability that a car chosen at random will have either four doors or a blue color, or both?
(Short Answer)
4.9/5 (43)
From a random sample of 100 cars, the following data on the number tires that need replacing was found:
NumberofTires Frequency 0 10 1 25 2 42 3 19 4 4
Find the weighted mean.
(Short Answer)
4.8/5 (43)
Rolling two standard six-sided dice, what is the probability of rolling a sum of 10 ?
(Short Answer)
4.8/5 (35)
In a sample of 850 ring bearings, the standard deviation is . What is the Standard Error of the sample?
(Short Answer)
4.9/5 (36)
A factory kept track of its defectives (from random samples of 500 ) for 10 days and the following data was found:
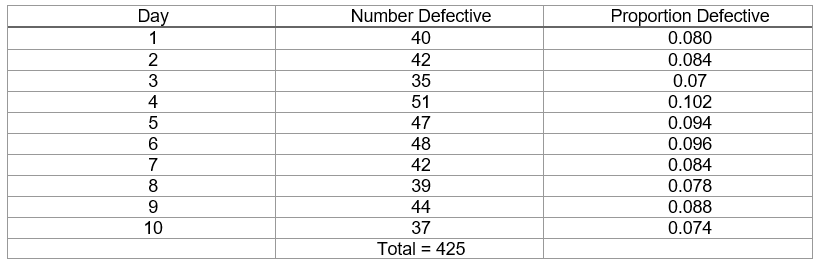 Find the values for the central line, and determine the upper and lower control limits.
(Short Answer)
4.9/5 (33)
We draw a ball from a bag that contains 5 red balls and 8 blue balls. We set aside the ball and draw another ball. What is the probability that both balls are blue balls?
(Short Answer)
4.8/5 (39)
Use the information below for questions.
The average monthly rainfall (cm) in several cities in a certain province are:
11.3 29.6 16.3 31.4 29.2 14.5 16.9 25.8 21.3 32.7 15.3 13.5 25.2 22.5 18.6 14.3 26.9 22.9
-(a) Determine the range of the data.
(b) Make an absolute frequency distribution using class widths of .
(c) Make a relative frequency distribution using class widths of .
(Essay)
4.8/5 (36)
Consider the below set of lengths for questions:
123 422 566 329 247 296 245 522 362 593 229 475 357 227 489 326
-Find the range of the lengths.
(Short Answer)
4.8/5 (37)
If a die is rolled seven times, what is the probability of obtaining exactly three sixes?
(Short Answer)
4.8/5 (35)
Find the correlation coefficient and the least squares line for the following data:
(Short Answer)
4.8/5 (36)
Filters
- Essay(0)
- Multiple Choice(0)
- Short Answer(0)
- True False(0)
- Matching(0)