Exam 3: Where Prices Come From: the Interaction of Demand and Supply
Exam 1: Economics: Foundations and Models160 Questions
Exam 2: Choices and Trade Offs in the Market192 Questions
Exam 3: Where Prices Come From: the Interaction of Demand and Supply201 Questions
Exam 4: Gdp: Measuring Total Production, Income and Economic Growth123 Questions
Exam 5: Economic Growth, the Financial System and Business Cycles132 Questions
Exam 6: Long-Run Economic Growth: Sources and Policies118 Questions
Exam 7: Unemployment120 Questions
Exam 8: Inflation110 Questions
Exam 9: Aggregate Expenditure and Output in the Short Run138 Questions
Exam 10: Aggregate Demand and Aggregate Supply Analysis134 Questions
Exam 11: Money, Banks and the Reserve Bank of Australia123 Questions
Exam 12: Monetary Policy116 Questions
Exam 13: Fiscal Policy163 Questions
Exam 14: Macroeconomics in an Open Economy141 Questions
Exam 15: The International Financial System145 Questions
Select questions type
A decrease in quantity supplied is represented by a leftward shift of the supply curve.
(True/False)
4.9/5  (29)
(29)
Figure 3.1
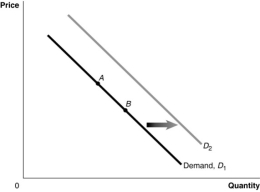 -Refer to Figure 3.1. An increase in population would be represented by a movement from:
(Multiple Choice)
4.8/5 (43)
Figure 3.2
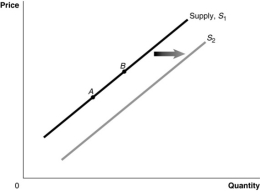 -Refer to Figure 3.2. A decrease in the price of the product would be represented by a movement from:
(Multiple Choice)
4.7/5 (27)
The market price for a product will fall when there is a surplus until:
(Multiple Choice)
4.9/5 (32)
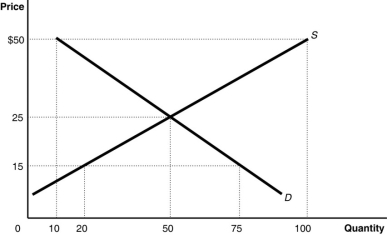
Figure 3.4
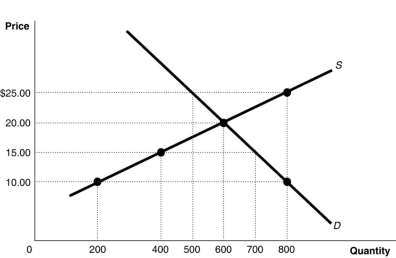 -Refer to Figure 3.4. If the current market price is $15, the market will achieve equilibrium by:
(Multiple Choice)
4.8/5 (30)
For each of the following pairs of products, state which are complements, which are substitutes, and which are unrelated.
a.Blu-ray discs and video-on-demand
b.Fiat 500 and Mini Cooper S
c.Toothpaste and toothbrush
d.Popcorn and snowboards
e.Razors and razor blades
_____________________________________________________________________________________________
_____________________________________________________________________________________________
(Essay)
4.7/5 (37)
If the demand for higher education increases as incomes increase, then higher education is:
(Multiple Choice)
4.8/5 (40)
Figure 3.8
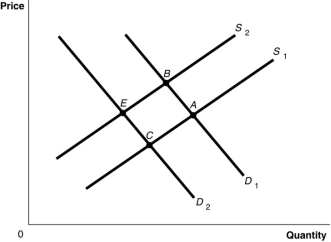 -Refer to Figure 3.8. The graph in this figure illustrates an initial competitive equilibrium in the market for apples at the intersection of D₂ and S₁ (point C). Which of the following changes would cause the equilibrium to change to point B?
(Multiple Choice)
4.8/5 (35)
Draw a demand curve and label it D₁. On the graph, illustrate an increase in demand and a decrease in demand, and label the curves D₂ and D₃, respectively. Starting on demand curve D₁, explain the shift that would result from each of the following events:
a.an increase in income and the good is a normal good
b.an increase in income and the good is an inferior good
c.a decrease in the price of a substitute good
d.a decrease in the price of a complementary good
e.an increase in the taste for the good
f.a decrease in population
g.an increase in the expected future price of the good
_____________________________________________________________________________________________
_____________________________________________________________________________________________
(Essay)
4.8/5 (42)
Assume that both the demand curve and the supply curve for tablet computers shift to the right, but the supply curve shifts more than the demand curve. As a result:
(Multiple Choice)
4.8/5 (36)
Figure 3.4
-Refer to Figure 3.4. At a price of $10, how many units will be sold?
(Multiple Choice)
4.8/5 (36)
By drawing a demand curve with ________ on the vertical axis and ________ on the horizontal axis, economists assume that the most important determinant of the demand for a good is the ________ of the good.
(Multiple Choice)
4.8/5 (32)
Figure 3.8
-Refer to Figure 3.8. The graph in this figure illustrates an initial competitive equilibrium in the market for apples at the intersection of D₁ and S₂ (point B). Which of the following changes would cause the equilibrium to change to point C?
(Multiple Choice)
4.8/5 (40)
Figure 3.4
-Refer to Figure 3.4. How many units will be sold at the equilibrium price?
(Multiple Choice)
4.9/5 (33)
What is the 'law of supply'? What does this law imply about the shape of the supply curve?
_____________________________________________________________________________________________
_____________________________________________________________________________________________
(Essay)
4.8/5 (38)
If the number of firms producing mouthwash increases and consumer preference for mouthwash increases, the equilibrium price of mouthwash will definitely increase.
(True/False)
4.8/5 (29)
Which of the following would cause an increase in the supply of cheese?
(Multiple Choice)
4.8/5 (37)
Figure 3.6
 -Refer to Figure 3-6. The figure above represents the market for canvas tote bags. Assume that the market price is $35. Which of the following statements is true?
(Multiple Choice)
4.7/5 (28)
Figure 3.2
-Refer to Figure 3.2. A decrease in the expected future price of the product would be represented by a movement from:
(Multiple Choice)
4.8/5 (34)
Let D = demand, S = supply, P = equilibrium price, Q = equilibrium quantity. What happens in the market for electric vehicles if the government offers incentives to manufacturers to produce more electric vehicles?
(Multiple Choice)
4.8/5 (37)
Filters
- Essay(0)
- Multiple Choice(0)
- Short Answer(0)
- True False(0)
- Matching(0)